Q3 2017 SUPPLEMENTAL INFORMATION
OCTOBER 31, 2017
©2017 Ameresco, Inc. All rights reserved. 2
USE OF NON-GAAP FINANCIAL MEASURES
Use of Non-GAAP Financial Measures
This presentation includes references to adjusted EBITDA, adjusted cash from operations, non-GAAP net income
and non-GAAP earnings per share, which are non-GAAP financial measures. For a description of these non-GAAP
financial measures, including the reasons management uses these measures, please see the section in the
Appendix in this presentation titled “Non-GAAP Financial Measures”. For a reconciliation of these non-GAAP
financial measures to the most directly comparable financial measures prepared in accordance with GAAP, please
see the tables in the Appendix to this presentation titled “GAAP to Non-GAAP Reconciliation.”
©2017 Ameresco, Inc. All rights reserved. 3
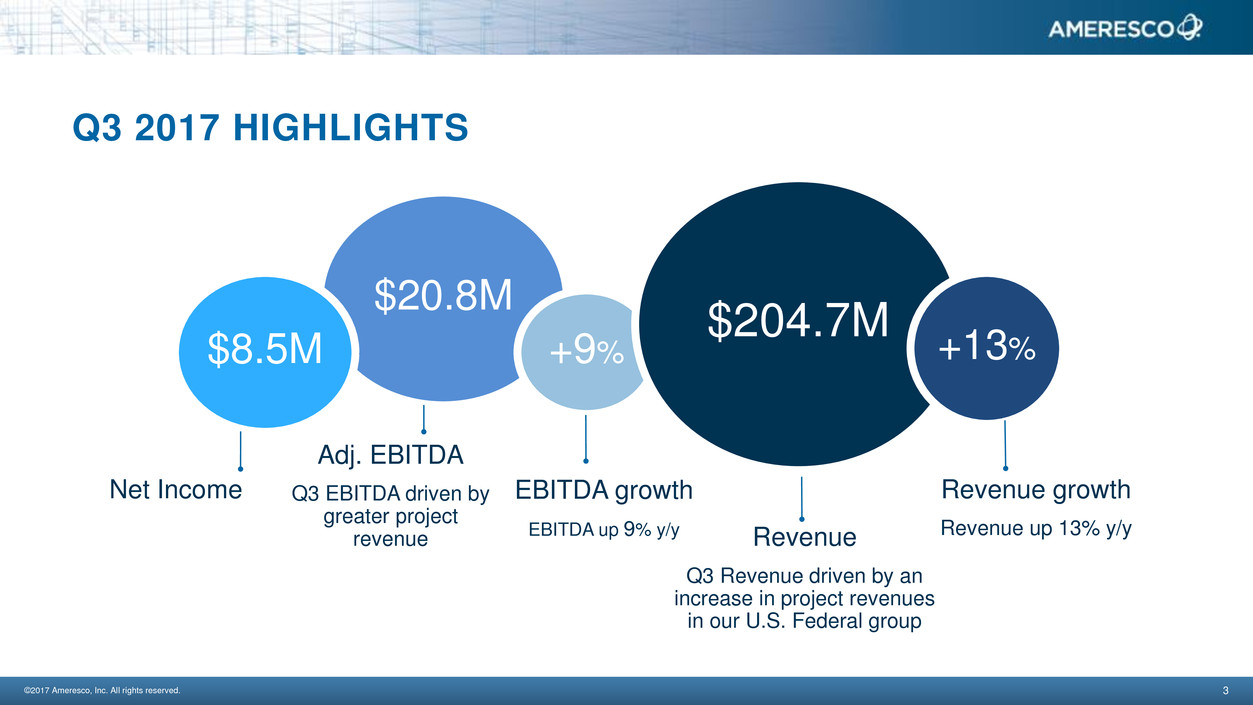
Q3 2017 HIGHLIGHTS
$20.8M
$8.5M +9%
$204.7M
+13%
Adj. EBITDA
Q3 EBITDA driven by
greater project
revenue
EBITDA growth
EBITDA up 9% y/y
Revenue growth
Revenue up 13% y/y Revenue
Q3 Revenue driven by an
increase in project revenues
in our U.S. Federal group
Net Income
©2017 Ameresco, Inc. All rights reserved. 4
BACKLOG PROVIDES VISIBILITY FOR 2-4 YEARS OF
PROJECT REVENUE
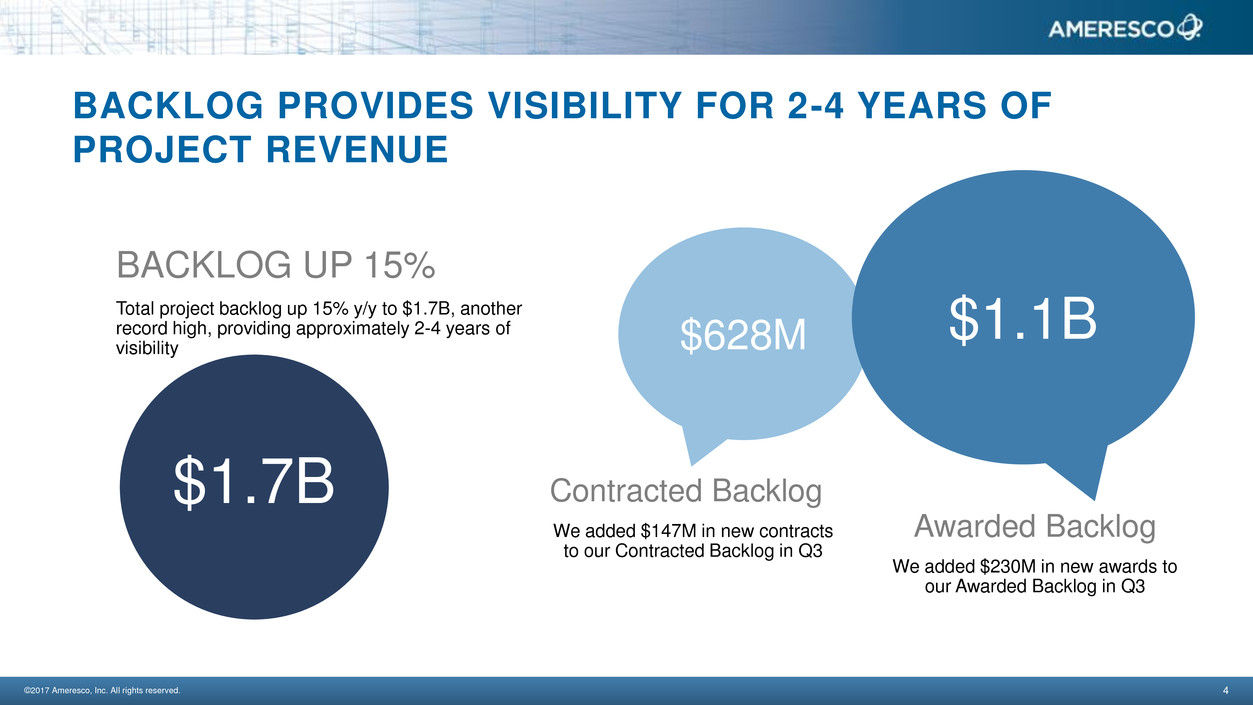
BACKLOG UP 15%
Total project backlog up 15% y/y to $1.7B, another
record high, providing approximately 2-4 years of
visibility
Contracted Backlog
We added $147M in new contracts
to our Contracted Backlog in Q3
$628M $1.1B
Awarded Backlog
We added $230M in new awards to
our Awarded Backlog in Q3
$1.7B
©2017 Ameresco, Inc. All rights reserved. 5
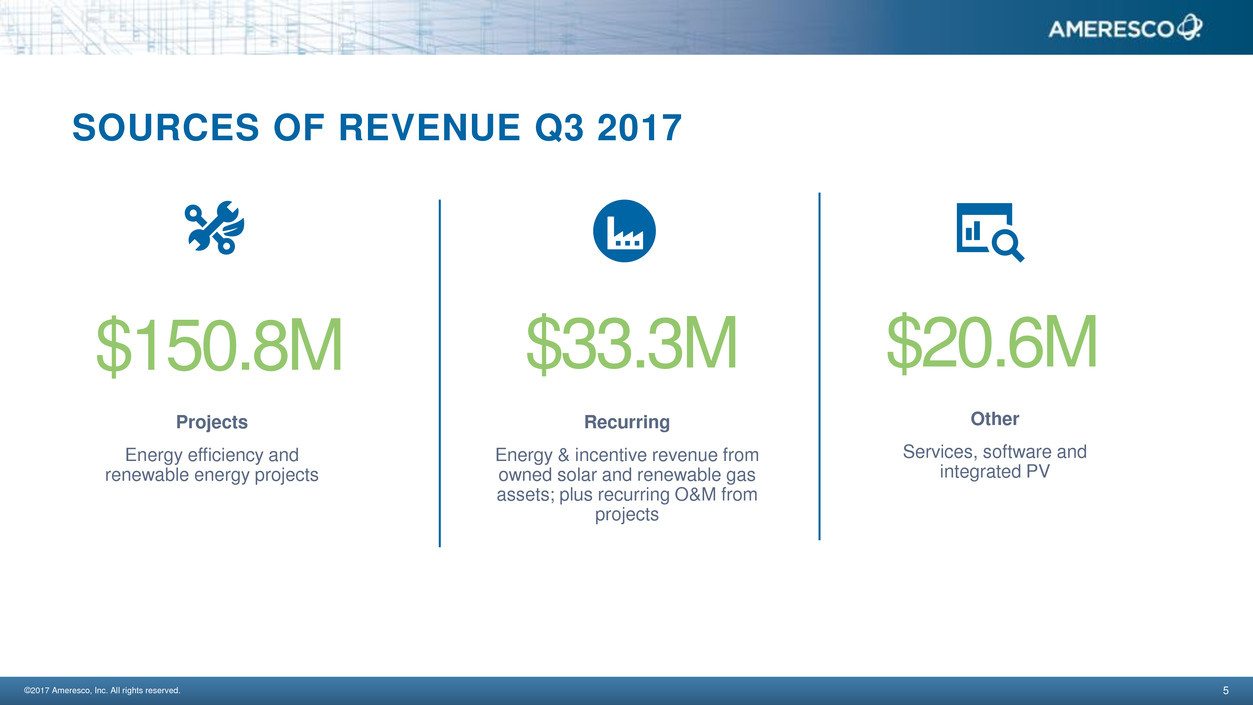
SOURCES OF REVENUE Q3 2017
$20.6M $33.3M $150.8M
Projects
Energy efficiency and
renewable energy projects
Recurring
Energy & incentive revenue from
owned solar and renewable gas
assets; plus recurring O&M from
projects
Other
Services, software and
integrated PV
©2017 Ameresco, Inc. All rights reserved.
6
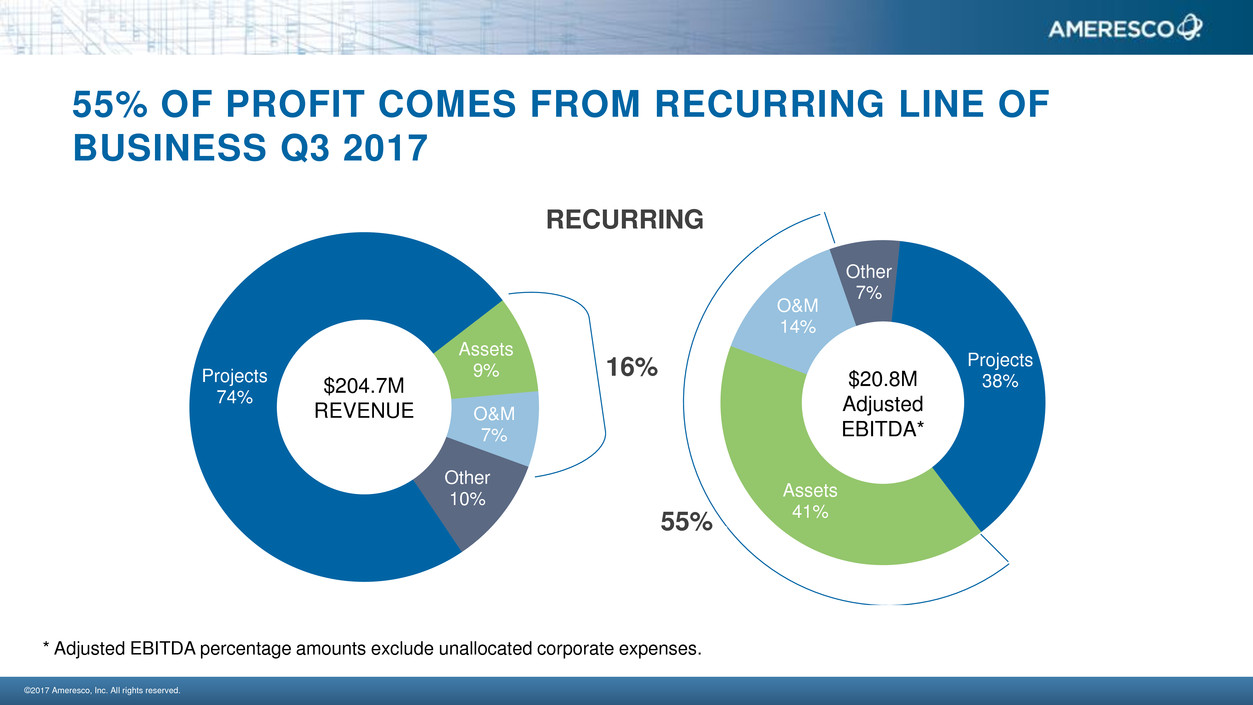
55% OF PROFIT COMES FROM RECURRING LINE OF
BUSINESS Q3 2017
16% Projects
74%
Assets
9%
O&M
7%
Other
10%
$204.7M
REVENUE
Projects
38%
Assets
41%
O&M
14%
Other
7%
$20.8M
Adjusted
EBITDA*
55%
* Adjusted EBITDA percentage amounts exclude unallocated corporate expenses.
RECURRING
©2017 Ameresco, Inc. All rights reserved. 7
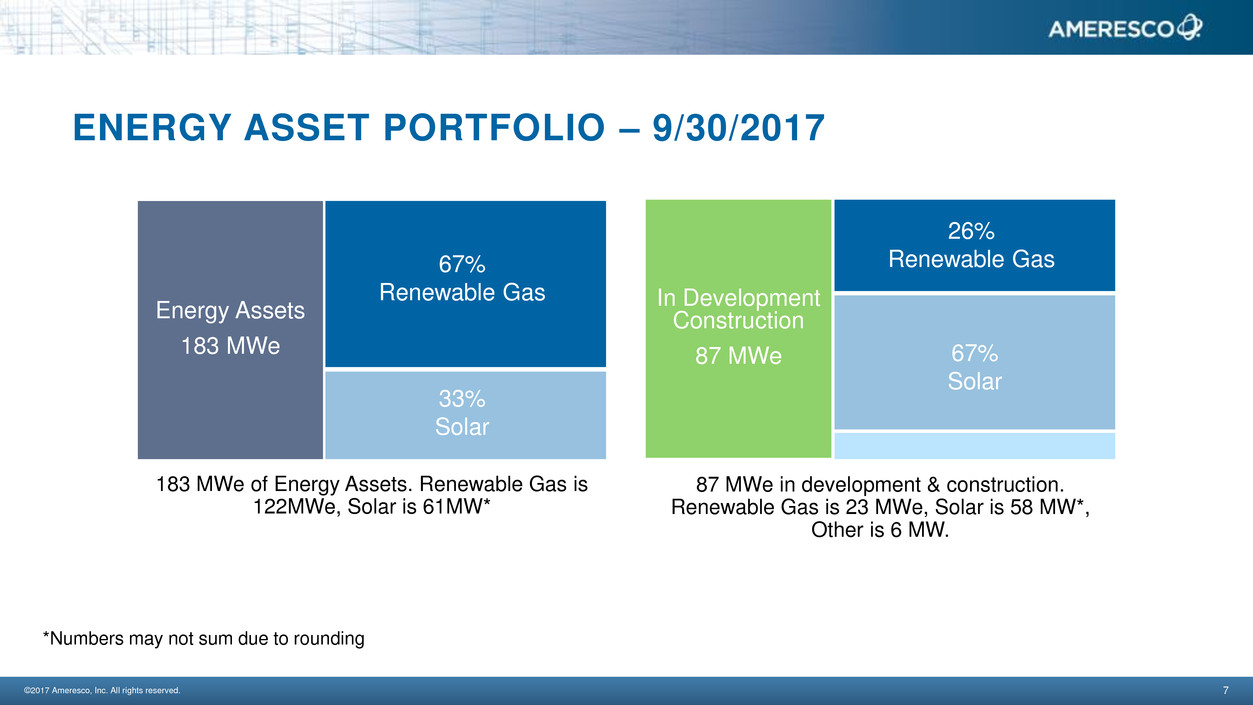
ENERGY ASSET PORTFOLIO – 9/30/2017
183 MWe of Energy Assets. Renewable Gas is
122MWe, Solar is 61MW*
Energy Assets
183 MWe
67%
Renewable Gas
33%
Solar
In Development
Construction
87 MWe
67%
Solar
26%
Renewable Gas
87 MWe in development & construction.
Renewable Gas is 23 MWe, Solar is 58 MW*,
Other is 6 MW.
*Numbers may not sum due to rounding
©2017 Ameresco, Inc. All rights reserved. 8
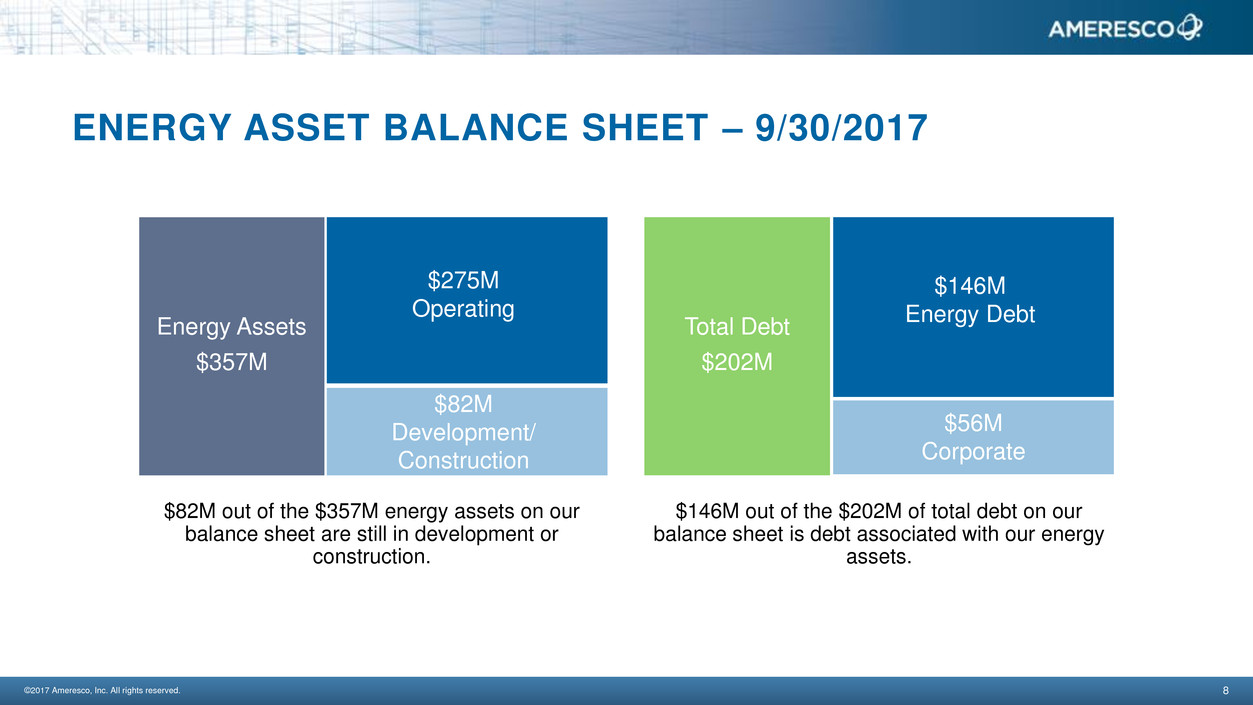
ENERGY ASSET BALANCE SHEET – 9/30/2017
$82M out of the $357M energy assets on our
balance sheet are still in development or
construction.
$146M out of the $202M of total debt on our
balance sheet is debt associated with our energy
assets.
Energy Assets
$357M
$275M
Operating
$82M
Development/
Construction
Total Debt
$202M
$56M
Corporate
$146M
Energy Debt

APPENDIX
©2017 Ameresco, Inc. All rights reserved. 10
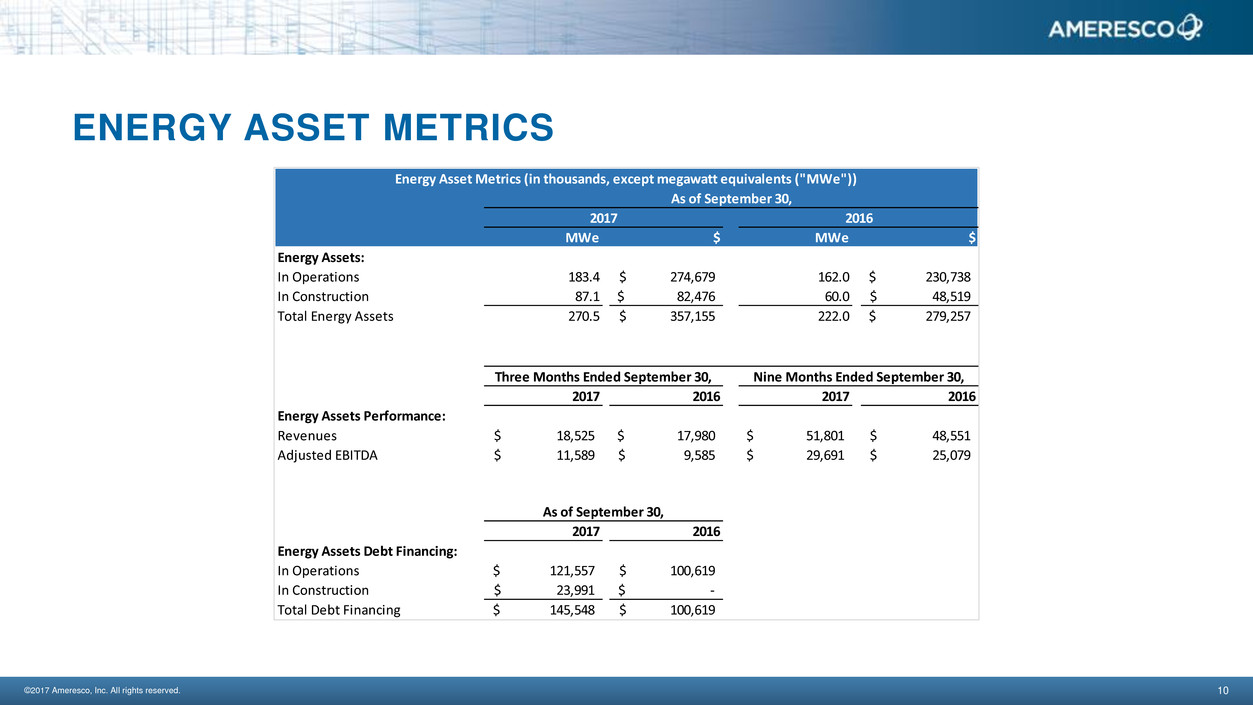
ENERGY ASSET METRICS
MWe $ MWe $
Energy Assets:
In Operations 183.4 274,679$ 162.0 230,738$
In Construction 87.1 82,476$ 60.0 48,519$
Total Energy Assets 270.5 357,155$ 222.0 279,257$
2017 2016 2017 2016
Energy Assets Performance:
Revenues 18,525$ 17,980$ 51,801$ 48,551$
Adjusted EBITDA 11,589$ 9,585$ 29,691$ 25,079$
2017 2016
Energy Assets Debt Financing:
In Operations 121,557$ 100,619$
In Construction 23,991$ -$
Total Debt Financing 145,548$ 100,619$
Energy Asset Metrics (in thousands, except megawatt equivalents ("MWe"))
As of September 30,
Three Months Ended September 30, Nine Months Ended September 30,
As of September 30,
2017 2016
©2017 Ameresco, Inc. All rights reserved. 11
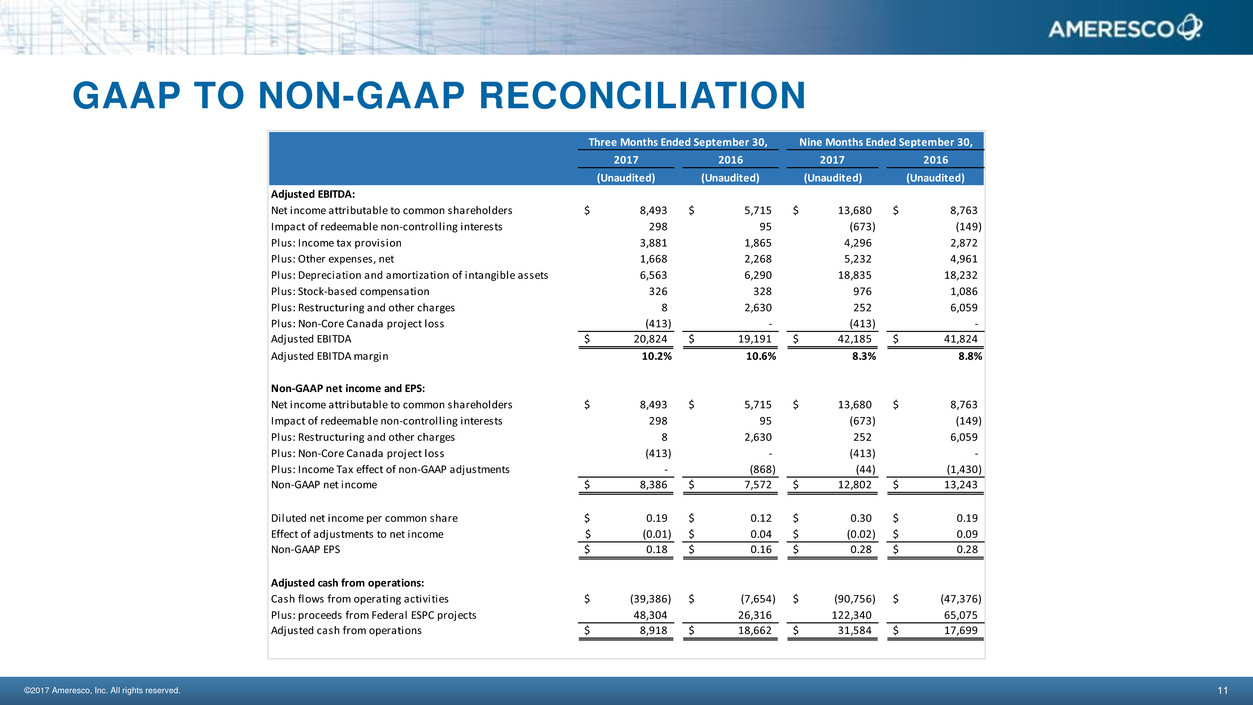
GAAP TO NON-GAAP RECONCILIATION
2017 2016 2017 2016
(Unaudited) (Unaudited) (Unaudited) (Unaudited)
Adjusted EBITDA:
Net income attributable to common shareholders 8,493$ 5,715$ 13,680$ 8,763$
Impact of redeemable non-controlling interests 298 95 (673) (149)
Plus: Income tax provision 3,881 1,865 4,296 2,872
Plus: Other expenses, net 1,668 2,268 5,232 4,961
Plus: Depreciation and amortization of intangible assets 6,563 6,290 18,835 18,232
Plus: Stock-based compensation 326 328 976 1,086
Plus: Restructuring and other charges 8 2,630 252 6,059
Plus: Non-Core Canada project loss (413) - (413) -
Adjusted EBITDA 20,824$ 19,191$ 42,185$ 41,824$
Adjusted EBITDA margin 10.2% 10.6% 8.3% 8.8%
Non-GAAP net income and EPS:
Net income attributable to common shareholders 8,493$ 5,715$ 13,680$ 8,763$
Impact of redeemable non-controlling interests 298 95 (673) (149)
Plus: Restructuring and other charges 8 2,630 252 6,059
Plus: Non-Core Canada project loss (413) - (413) -
Plus: Income Tax effect of non-GAAP adjustments - (868) (44) (1,430)
Non-GAAP net income 8,386$ 7,572$ 12,802$ 13,243$
Diluted net income per common share 0.19$ 0.12$ 0.30$ 0.19$
Effect of adjustments to net income (0.01)$ 0.04$ (0.02)$ 0.09$
Non-GAAP EPS 0.18$ 0.16$ 0.28$ 0.28$
Adjusted cash from operations:
Cash flows from operating activities (39,386)$ (7,654)$ (90,756)$ (47,376)$
Plus: proceeds from Federal ESPC projects 48,304 26,316 122,340 65,075
Adjusted cash from operations 8,918$ 18,662$ 31,584$ 17,699$
Three Months Ended September 30, Nine Months Ended September 30,
©2017 Ameresco, Inc. All rights reserved. 12
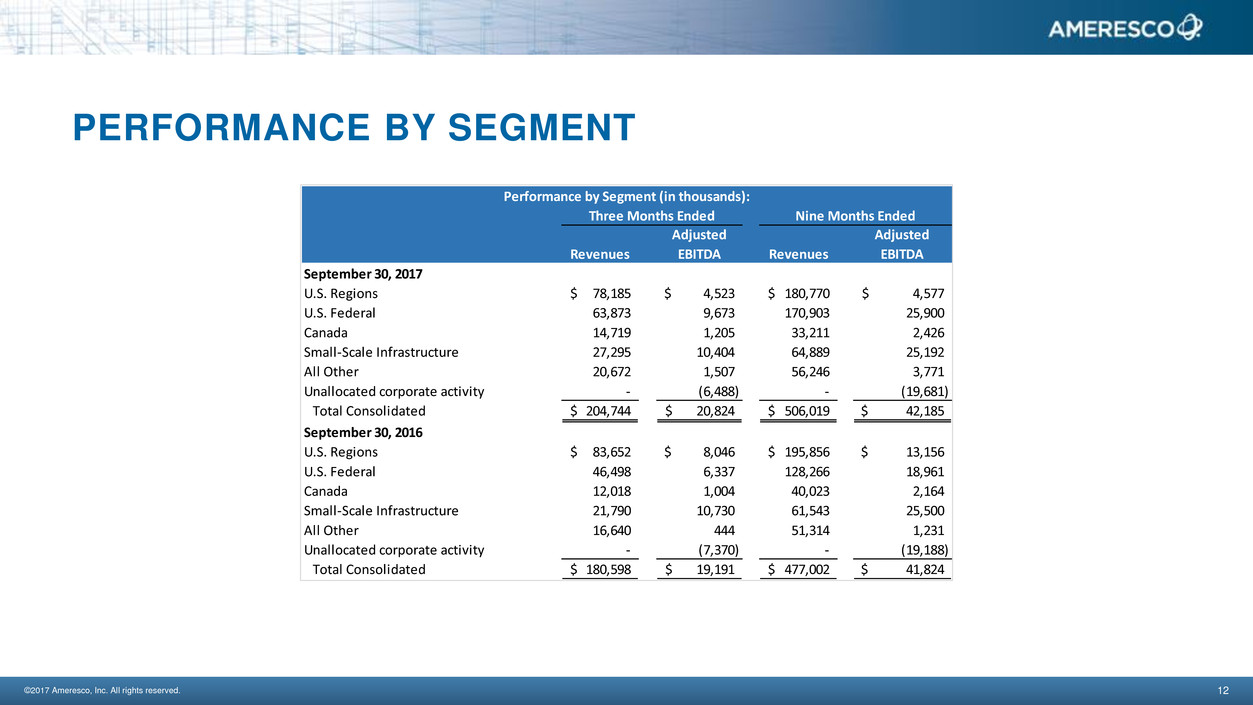
PERFORMANCE BY SEGMENT
Revenues
Adjusted
EBITDA Revenues
Adjusted
EBITDA
September 30, 2017
U.S. Regions 78,185$ 4,523$ 180,770$ 4,577$
U.S. Federal 63,873 9,673 170,903 25,900
Canada 14,719 1,205 33,211 2,426
Small-Scale Infrastructure 27,295 10,404 64,889 25,192
All Other 20,672 1,507 56,246 3,771
Unallocated corporate activity - (6,488) - (19,681)
Total Consolidated 204,744$ 20,824$ 506,019$ 42,185$
September 30, 2016
U.S. Regions 83,652$ 8,046$ 195,856$ 13,156$
U.S. Federal 46,498 6,337 128,266 18,961
Canada 12,018 1,004 40,023 2,164
Small-Scale Infrastructure 21,790 10,730 61,543 25,500
All Other 16,640 444 51,314 1,231
Unallocated corporate activity - (7,370) - (19,188)
Total Consolidated 180,598$ 19,191$ 477,002$ 41,824$
Three Months Ended Nine Months Ended
Performance by Segment (in thousands):
©2017 Ameresco, Inc. All rights reserved. 13
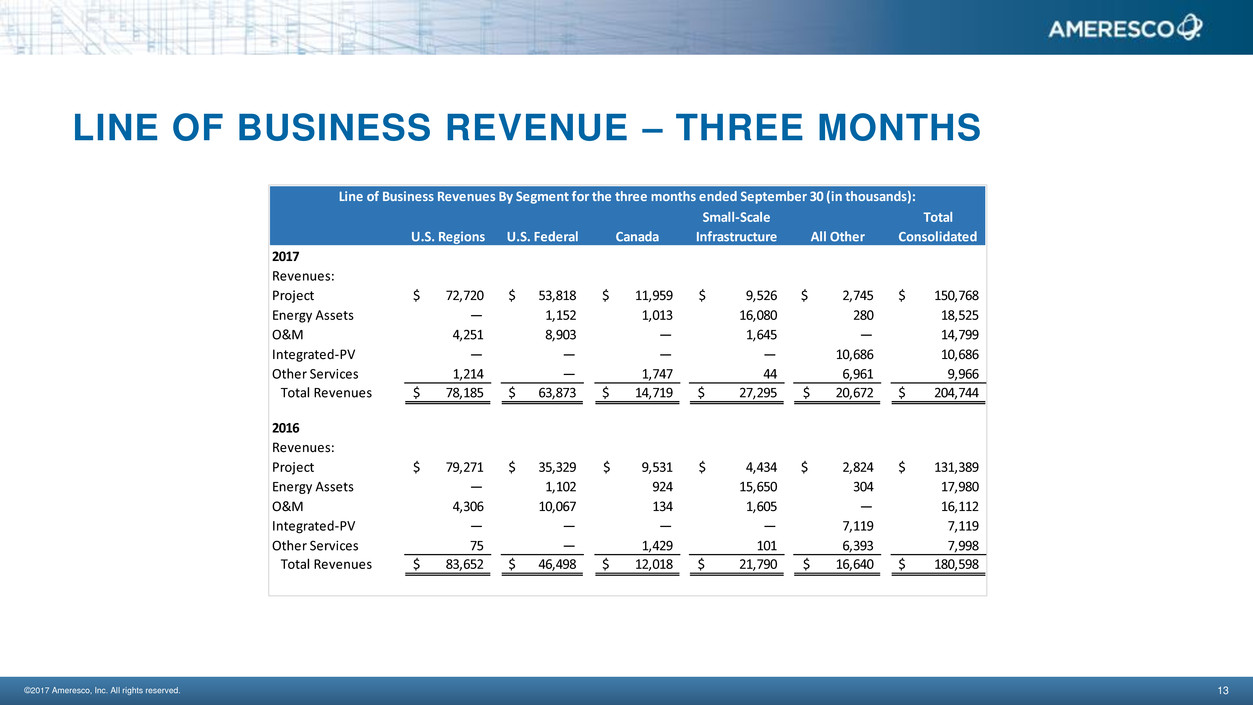
LINE OF BUSINESS REVENUE – THREE MONTHS
U.S. Regions U.S. Federal Canada
Small-Scale
Infrastructure All Other
Total
Consolidated
2017
Revenues:
Project 72,720$ 53,818$ 11,959$ 9,526$ 2,745$ 150,768$
Energy Assets — 1,152 1,013 16,080 280 18,525
O&M 4,251 8,903 — 1,645 — 14,799
Integrated-PV — — — — 10,686 10,686
Other Services 1,214 — 1,747 44 6,961 9,966
Total Revenues 78,185$ 63,873$ 14,719$ 27,295$ 20,672$ 204,744$
2016
Revenues:
Project 79,271$ 35,329$ 9,531$ 4,434$ 2,824$ 131,389$
Energy Assets — 1,102 924 15,650 304 17,980
O&M 4,306 10,067 134 1,605 — 16,112
Integrated-PV — — — — 7,119 7,119
Other Services 75 — 1,429 101 6,393 7,998
Total Revenues 83,652$ 46,498$ 12,018$ 21,790$ 16,640$ 180,598$
Line of Business Revenues By Segment for the three months ended September 30 (in thousands):
©2017 Ameresco, Inc. All rights reserved. 14
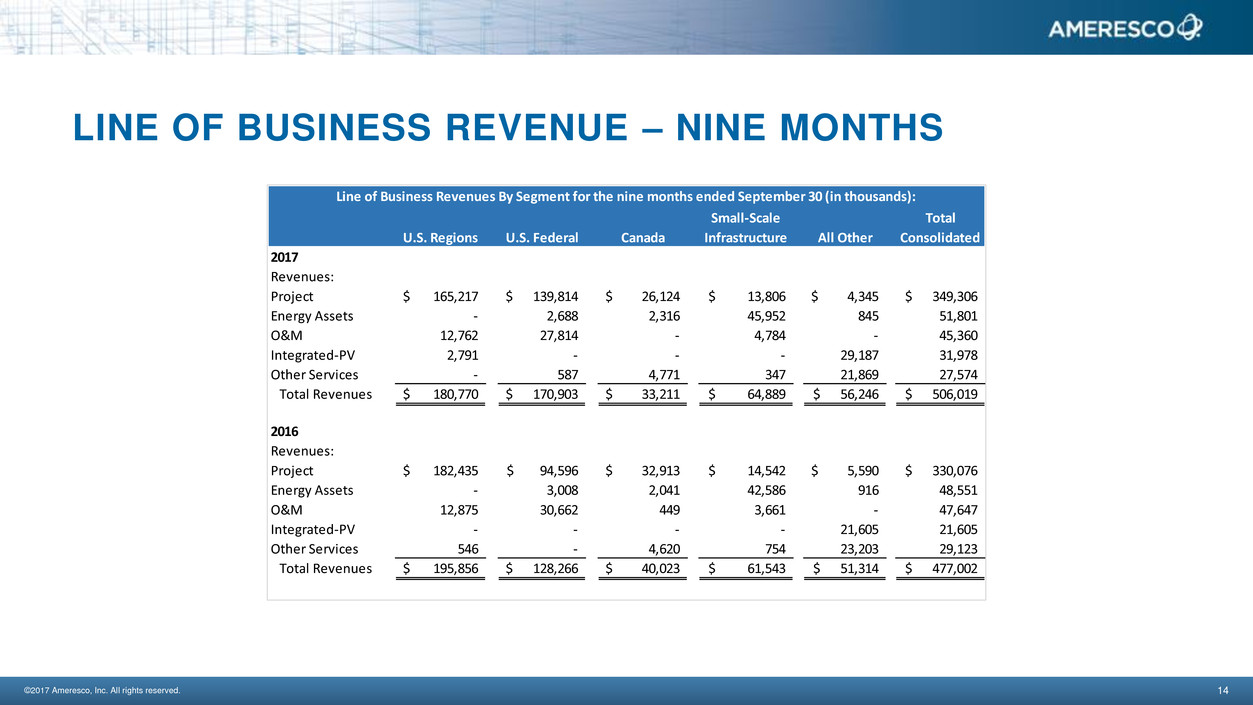
LINE OF BUSINESS REVENUE – NINE MONTHS
U.S. Regions U.S. Federal Canada
Small-Scale
Infrastructure All Other
Total
Consolidated
2017
Revenues:
Project 165,217$ 139,814$ 26,124$ 13,806$ 4,345$ 349,306$
Energy Assets - 2,688 2,316 45,952 845 51,801
O&M 12,762 27,814 - 4,784 - 45,360
Integrated-PV 2,791 - - - 29,187 31,978
Other Services - 587 4,771 347 21,869 27,574
Total Revenues 180,770$ 170,903$ 33,211$ 64,889$ 56,246$ 506,019$
2016
Revenues:
Project 182,435$ 94,596$ 32,913$ 14,542$ 5,590$ 330,076$
Energy Assets - 3,008 2,041 42,586 916 48,551
O&M 12,875 30,662 449 3,661 - 47,647
Integrated-PV - - - - 21,605 21,605
Other Services 546 - 4,620 754 23,203 29,123
Total Revenues 195,856$ 128,266$ 40,023$ 61,543$ 51,314$ 477,002$
Line of Business Revenues By Segment for the nine months ended September 30 (in thousands):

Your Trusted Sustainability Partner
ameresco.com