Q2 2019 SUPPLEMENTAL INFORMATION AUGUST 8, 2019
Forward Looking Statements Any statements in this presentation about future expectations, plans and prospects for Ameresco, Inc., including statements about market conditions, pipeline and backlog, as well as estimated future revenues and net income, and other statements containing the words “projects,” “believes,” “anticipates,” “plans,” “expects,” “will” and similar expressions, constitute forward-looking statements within the meaning of The Private Securities Litigation Reform Act of 1995. Actual results may differ materially from those indicated by such forward-looking statements as a result of various important factors, including the timing of, and ability to, enter into contracts for awarded projects on the terms proposed; the timing of work we do on projects where we recognize revenue on a percentage of completion basis, including the ability to perform under recently signed contracts without unusual delay; our ability to place solar assets into service as planned; demand for our energy efficiency and renewable energy solutions; our ability to arrange financing for our projects; changes in federal, state and local government policies and programs related to energy efficiency and renewable energy; the ability of customers to cancel or defer contracts included in our backlog; the effects of our recent acquisitions and restructuring activities; seasonality in construction and in demand for our products and services; a customer’s decision to delay our work on, or other risks involved with, a particular project; availability and costs of labor and equipment; the addition of new customers or the loss of existing customers; market price of the Company's stock prevailing from time to time; the nature of other investment opportunities presented to the Company from time to time; the Company's cash flows from operations and other factors discussed in our Annual Report on Form 10-K for the year ended December 31, 2018, filed with the U.S. Securities and Exchange Commission on March 8, 2019. In addition, the forward-looking statements included in this presentation represent our views as of the date of this presentation. We anticipate that subsequent events and developments will cause our views to change. However, while we may elect to update these forward-looking statements at some point in the future, we specifically disclaim any obligation to do so. These forward-looking statements should not be relied upon as representing our views as of any date subsequent to the date of this presentation. Use of Non-GAAP Financial Measures This presentation includes references to adjusted EBITDA, adjusted cash from operations, non-GAAP net income and non-GAAP earnings per share, which are non-GAAP financial measures. For a description of these non-GAAP financial measures, including the reasons management uses these measures, please see the section in the Appendix in this presentation titled “Non-GAAP Financial Measures”. For a reconciliation of these non-GAAP financial measures to the most directly comparable financial measures prepared in accordance with GAAP, please see the tables in the Appendix to this presentation titled “GAAP to Non- GAAP Reconciliation,” Non-GAAP Financial Guidance” and “Non-GAAP Financial Measures.” ©2019 Ameresco, Inc. All rights reserved. 2
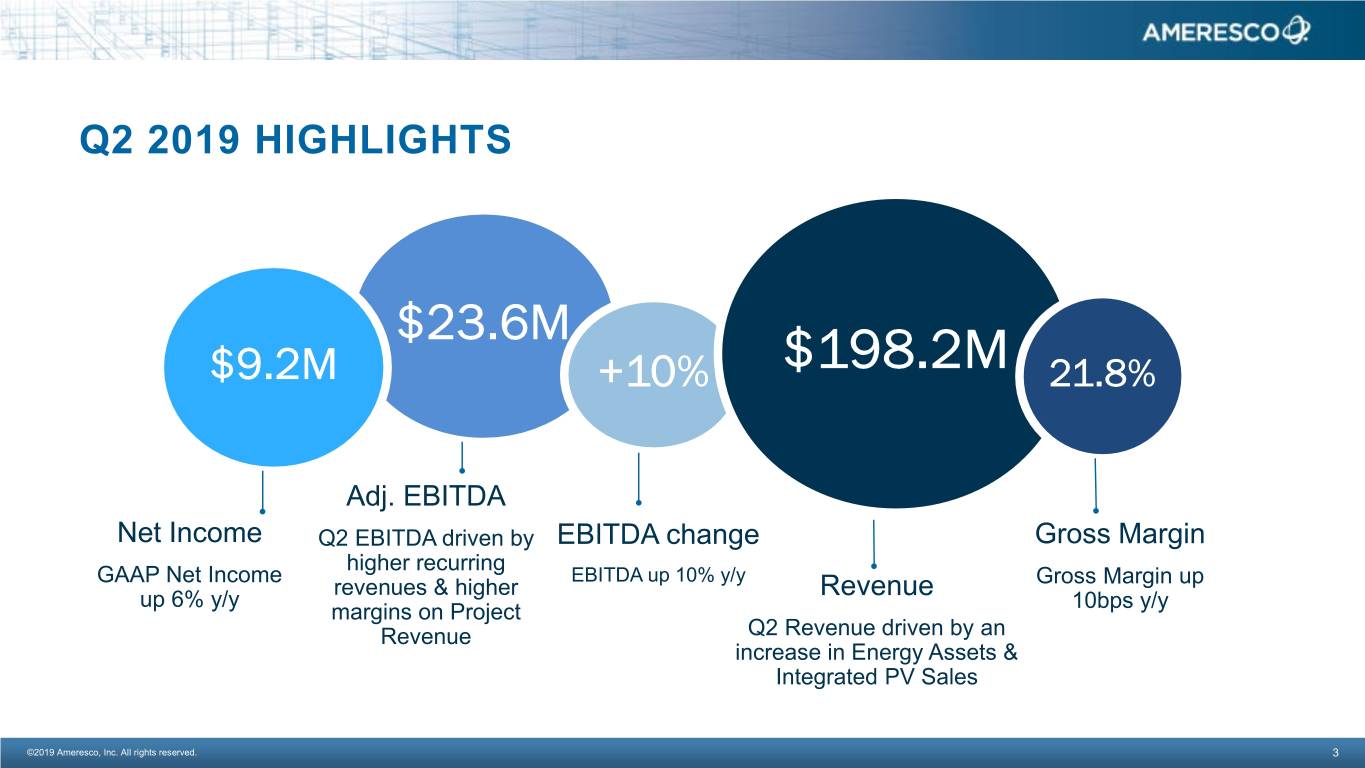
Q2 2019 HIGHLIGHTS $23.6M $9.2M +10% $198.2M 21.8% Adj. EBITDA Net Income Q2 EBITDA driven by EBITDA change Gross Margin higher recurring GAAP Net Income EBITDA up 10% y/y Gross Margin up revenues & higher up 6% y/y Revenue 10bps y/y margins on Project Revenue Q2 Revenue driven by an increase in Energy Assets & Integrated PV Sales ©2019 Ameresco, Inc. All rights reserved. 3

SOURCES OF REVENUE Q2 2019 $133.2M $41.8M $23.2M Projects Recurring Other Energy efficiency and Energy & incentive revenue from Services, software and renewable energy projects owned solar and renewable gas integrated PV assets; plus recurring O&M from projects ©2019 Ameresco, Inc. All rights reserved. 4
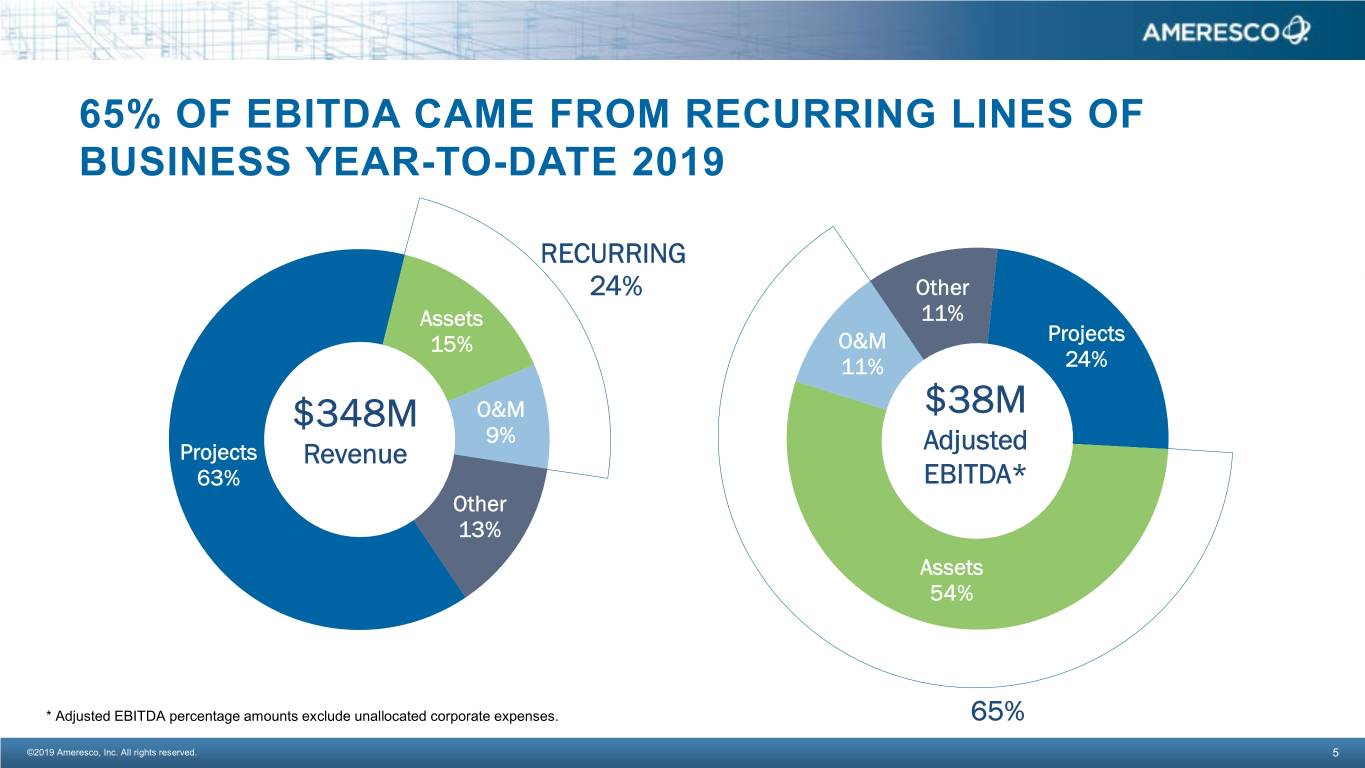
65% OF EBITDA CAME FROM RECURRING LINES OF BUSINESS YEAR-TO-DATE 2019 RECURRING 24% Other Assets 11% 15% O&M Projects 11% 24% O&M $38M $348M 9% Projects Revenue` Adjusted 63% EBITDA* Other 13% Assets 54% * Adjusted EBITDA percentage amounts exclude unallocated corporate expenses. 65% ©2019 Ameresco, Inc. All rights reserved. 5
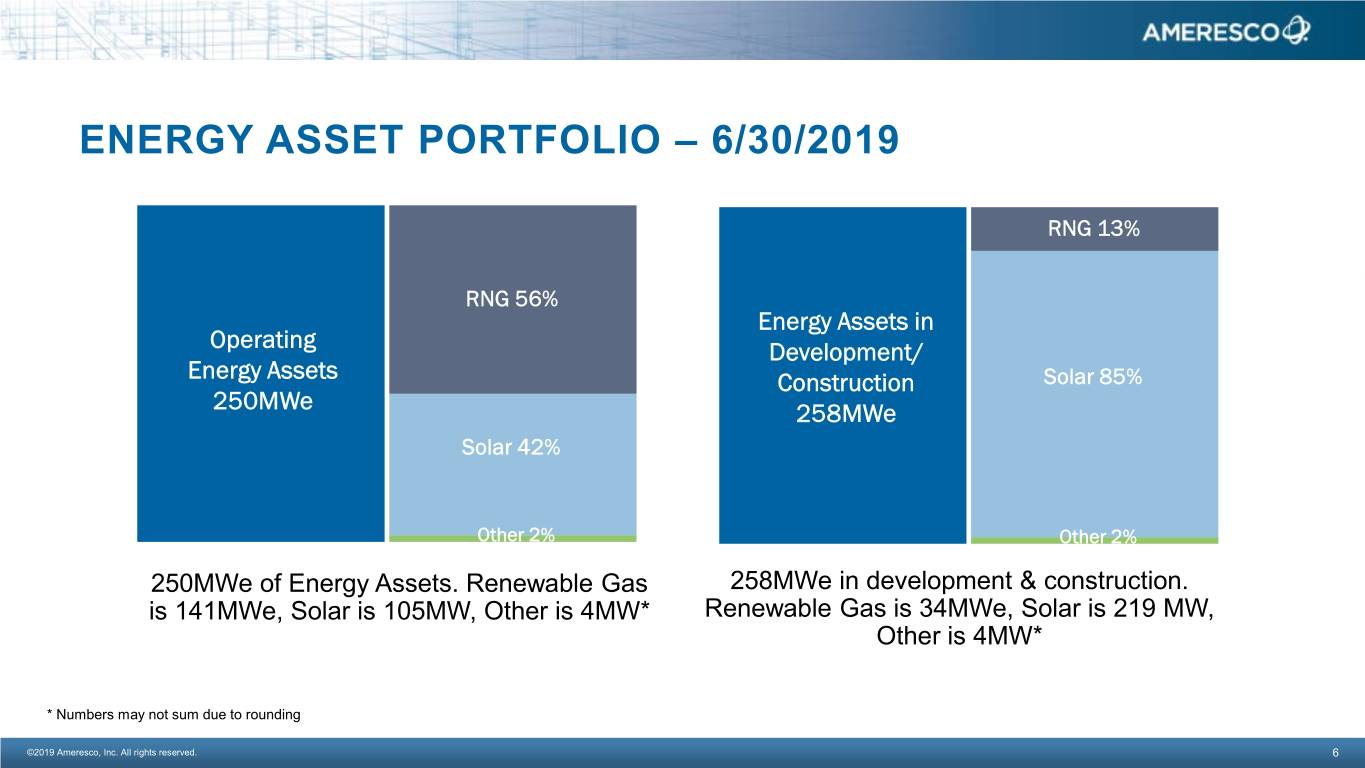
ENERGY ASSET PORTFOLIO – 6/30/2019 RNG 13% RNG 56% Energy Assets in Operating Development/ Energy Assets Construction Solar 85% 250MWe 258MWe Solar 42% Other 2% Other 2% 250MWe of Energy Assets. Renewable Gas 258MWe in development & construction. is 141MWe, Solar is 105MW, Other is 4MW* Renewable Gas is 34MWe, Solar is 219 MW, Other is 4MW* * Numbers may not sum due to rounding ©2019 Ameresco, Inc. All rights reserved. 6
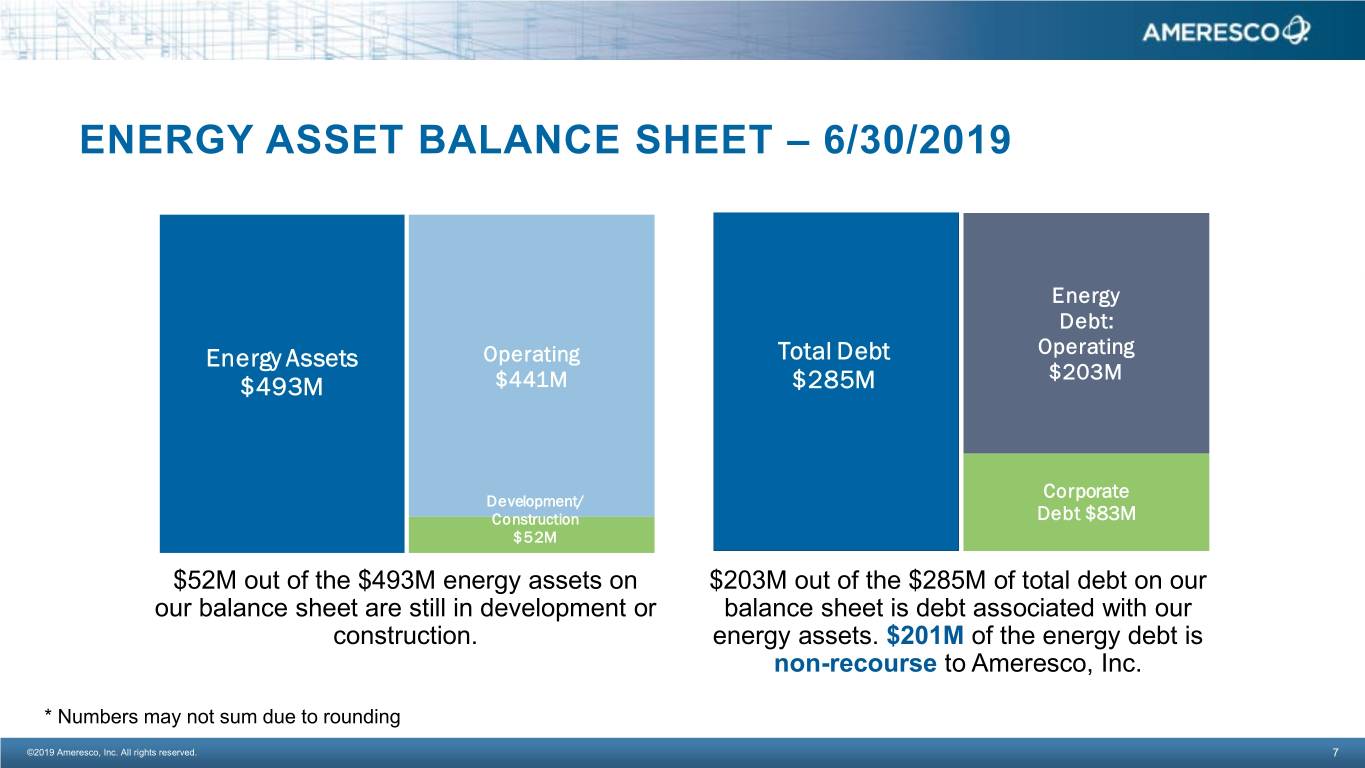
ENERGY ASSET BALANCE SHEET – 6/30/2019 Energy Debt: Energy Assets Operating Total Debt Operating $203M $493M $441M $285M Development/ Development/ Corporate ConstructionConstruction Debt $83M $52M $52M out of the $493M energy assets on $203M out of the $285M of total debt on our our balance sheet are still in development or balance sheet is debt associated with our construction. energy assets. $201M of the energy debt is non-recourse to Ameresco, Inc. * Numbers may not sum due to rounding ©2019 Ameresco, Inc. All rights reserved. 7
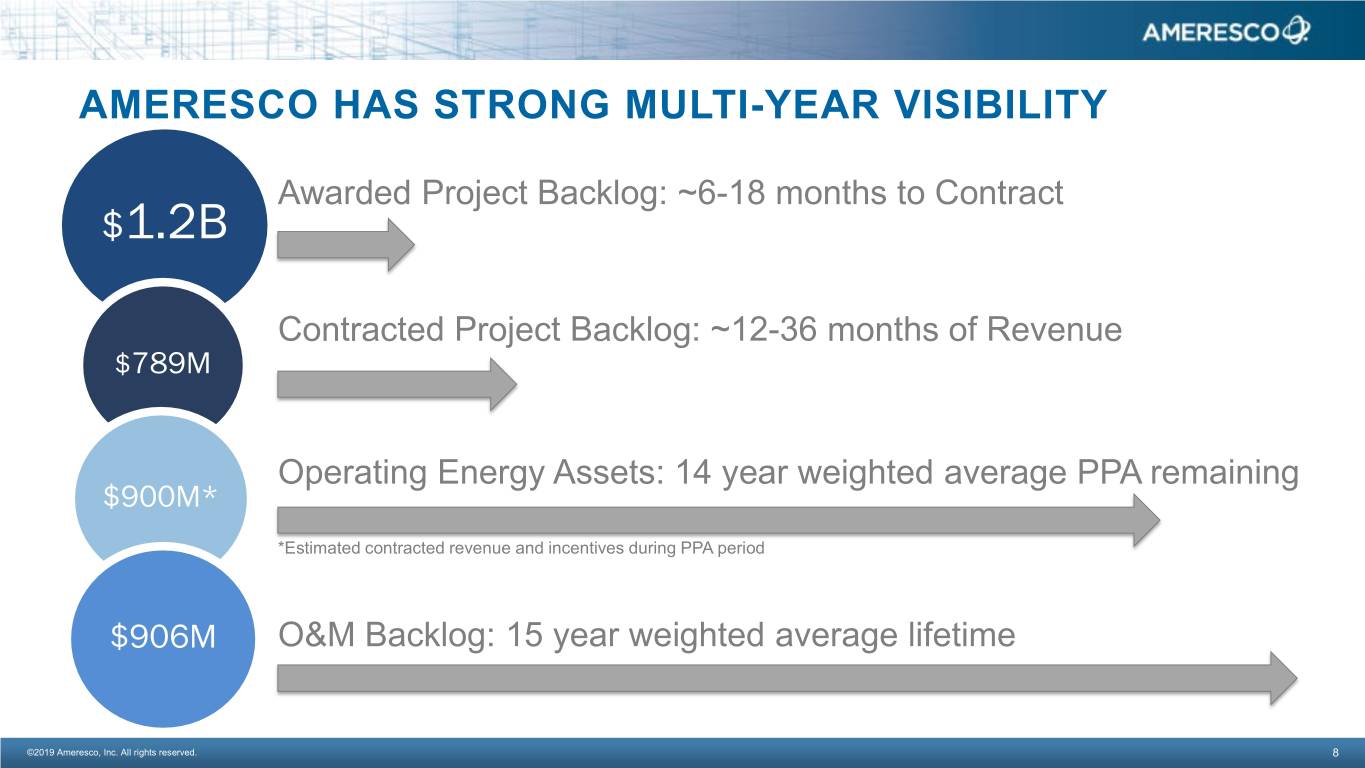
AMERESCO HAS STRONG MULTI-YEAR VISIBILITY Awarded Project Backlog: ~6-18 months to Contract $1.2B Contracted Project Backlog: ~12-36 months of Revenue $789M Operating Energy Assets: 14 year weighted average PPA remaining $900M* *Estimated contracted revenue and incentives during PPA period $906M O&M Backlog: 15 year weighted average lifetime ©2019 Ameresco, Inc. All rights reserved. 8

SUSTAINABLE AND PROFITABLE BUSINESS MODEL EXPANDING EARNINGS AT A FASTER RATE THAN REVENUE BY GROWING HIGHER MARGIN RECURRING LINES OF BUSINESS Revenue ($M) Adjusted EBITDA ($M) $865 $787 $717 $99 $631 $651 $91 $593 $63 $56 $41 $46 2014 2015 2016 2017 2018 2019 2014 2015 2016 2017 2018 2019 Guidance Guidance Mid Point Mid Point Guidance reaffirmed August 9, 2017 ©2019 Ameresco, Inc. All rights reserved. 9
APPENDIX
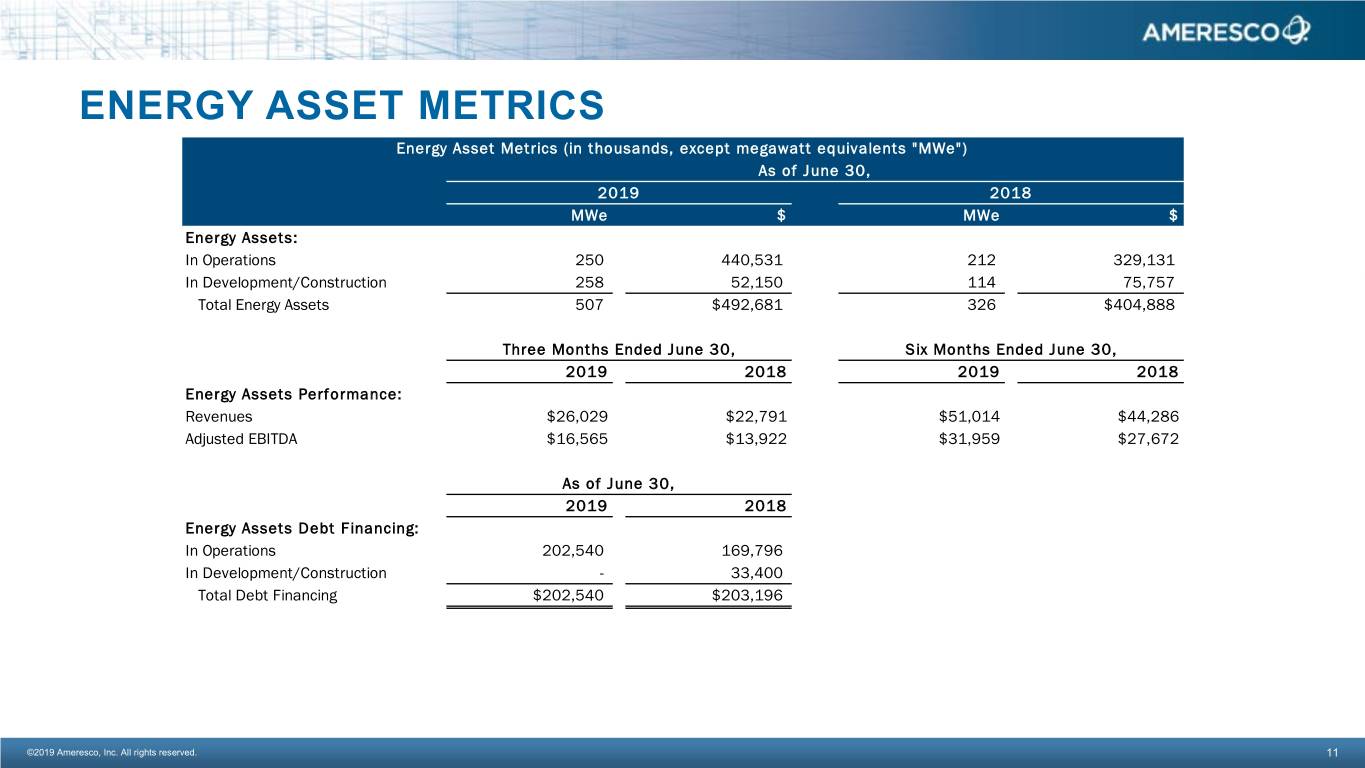
ENERGY ASSET METRICS Energy Asset Metrics (in thousands, except megawatt equivalents "MWe") As of June 30, 2019 2018 MWe $ MWe $ Energy Assets: In Operations 250 440,531 212 329,131 In Development/Construction 258 52,150 114 75,757 Total Energy Assets 507 $492,681 326 $404,888 Three Months Ended June 30, Six Months Ended June 30, 2019 2018 2019 2018 Energy Assets Performance: Revenues $26,029 $22,791 $51,014 $44,286 Adjusted EBITDA $16,565 $13,922 $31,959 $27,672 As of June 30, 2019 2018 Energy Assets Debt Financing: In Operations 202,540 169,796 In Development/Construction - 33,400 Total Debt Financing $202,540 $203,196 ©2019 Ameresco, Inc. All rights reserved. 11
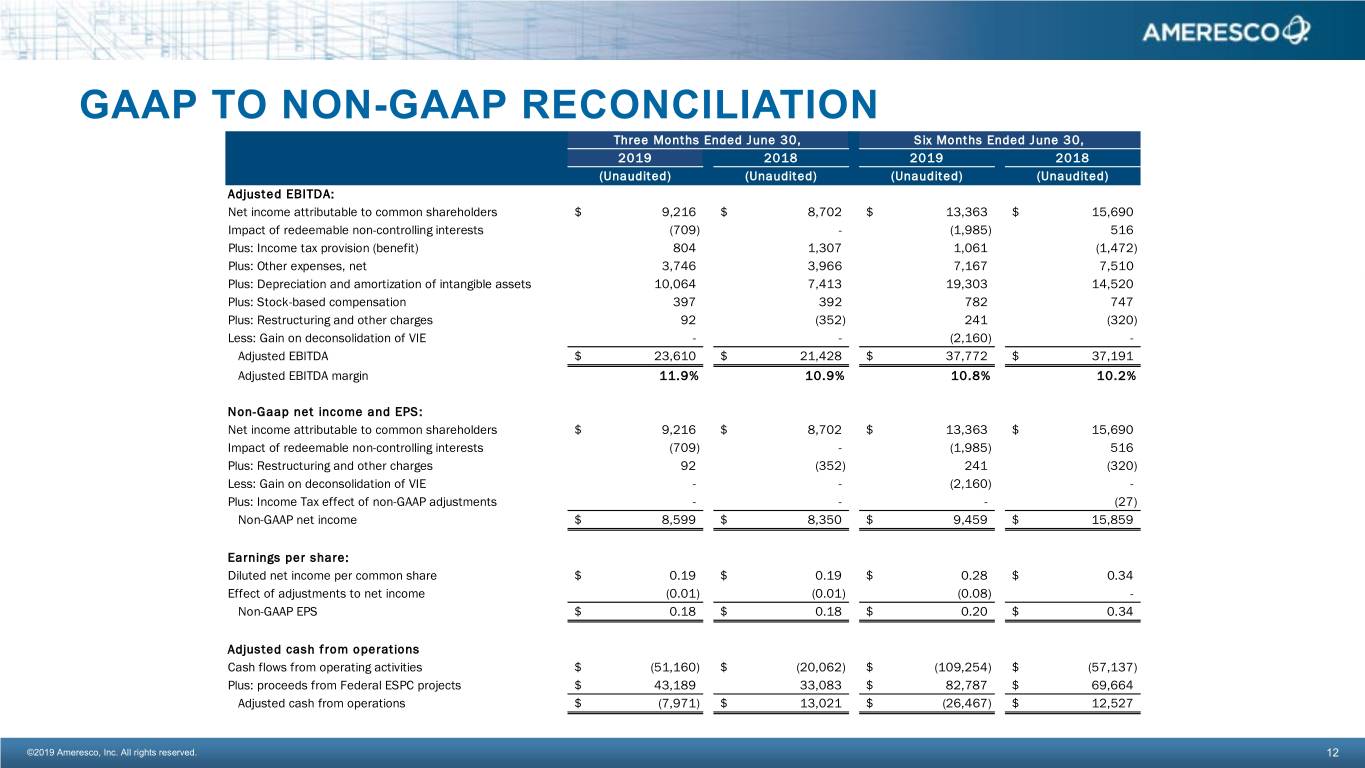
GAAP TO NON-GAAP RECONCILIATION Three Months Ended June 30, Six Months Ended June 30, 2019 2018 2019 2018 (Unaudited) (Unaudited) (Unaudited) (Unaudited) Adjusted EBITDA: Net income attributable to common shareholders $ 9,216 $ 8,702 $ 13,363 $ 15,690 Impact of redeemable non-controlling interests (709) - (1,985) 516 Plus: Income tax provision (benefit) 804 1,307 1,061 (1,472) Plus: Other expenses, net 3,746 3,966 7,167 7,510 Plus: Depreciation and amortization of intangible assets 10,064 7,413 19,303 14,520 Plus: Stock-based compensation 397 392 782 747 Plus: Restructuring and other charges 92 (352) 241 (320) Less: Gain on deconsolidation of VIE - - (2,160) - Adjusted EBITDA $ 23,610 $ 21,428 $ 37,772 $ 37,191 Adjusted EBITDA margin 11.9% 10.9% 10.8% 10.2% Revenue 198,183 196,981 348,295 364,392 Non-Gaap net income and EPS: Net income attributable to common shareholders $ 9,216 $ 8,702 $ 13,363 $ 15,690 Impact of redeemable non-controlling interests (709) - (1,985) 516 Plus: Restructuring and other charges 92 (352) 241 (320) Less: Gain on deconsolidation of VIE - - (2,160) - Plus: Income Tax effect of non-GAAP adjustments - - - (27) Non-GAAP net income $ 8,599 $ 8,350 $ 9,459 $ 15,859 Earnings per share: Diluted net income per common share $ 0.19 $ 0.19 $ 0.28 $ 0.34 Effect of adjustments to net income (0.01) (0.01) (0.08) - Non-GAAP EPS $ 0.18 $ 0.18 $ 0.20 $ 0.34 Adjusted cash from operations Cash flows from operating activities $ (51,160) $ (20,062) $ (109,254) $ (57,137) Plus: proceeds from Federal ESPC projects $ 43,189 33,083 $ 82,787 $ 69,664 Adjusted cash from operations $ (7,971) $ 13,021 $ (26,467) $ 12,527 ©2019 Ameresco, Inc. All rights reserved. 12
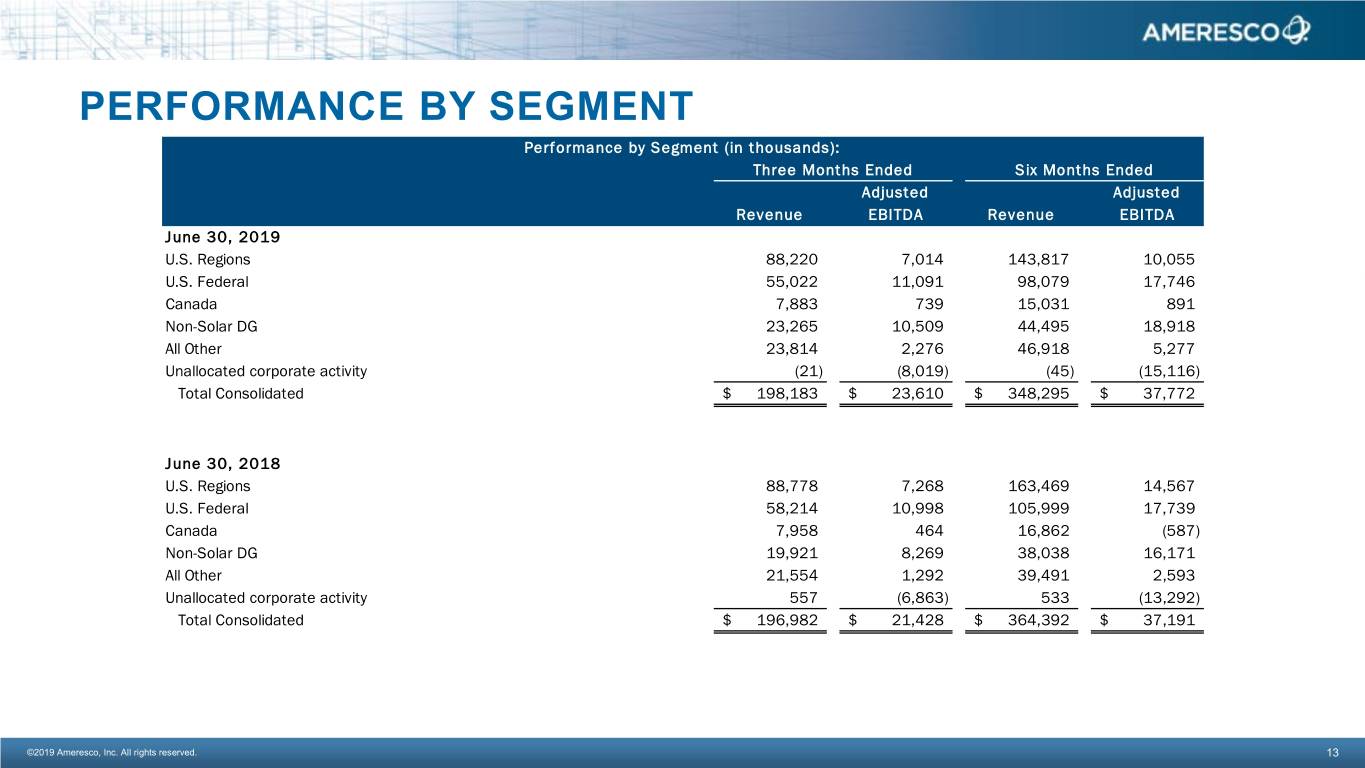
PERFORMANCE BY SEGMENT Performance by Segment (in thousands): Three Months Ended Six Months Ended Adjusted Adjusted Revenue EBITDA Revenue EBITDA June 30, 2019 U.S. Regions 88,220 7,014 143,817 10,055 U.S. Federal 55,022 11,091 98,079 17,746 Canada 7,883 739 15,031 891 Non-Solar DG 23,265 10,509 44,495 18,918 All Other 23,814 2,276 46,918 5,277 Unallocated corporate activity (21) (8,019) (45) (15,116) Total Consolidated $ 198,183 $ 23,610 $ 348,295 $ 37,772 June 30, 2018 U.S. Regions 88,778 7,268 163,469 14,567 U.S. Federal 58,214 10,998 105,999 17,739 Canada 7,958 464 16,862 (587) Non-Solar DG 19,921 8,269 38,038 16,171 All Other 21,554 1,292 39,491 2,593 Unallocated corporate activity 557 (6,863) 533 (13,292) Total Consolidated $ 196,982 $ 21,428 $ 364,392 $ 37,191 ©2019 Ameresco, Inc. All rights reserved. 13
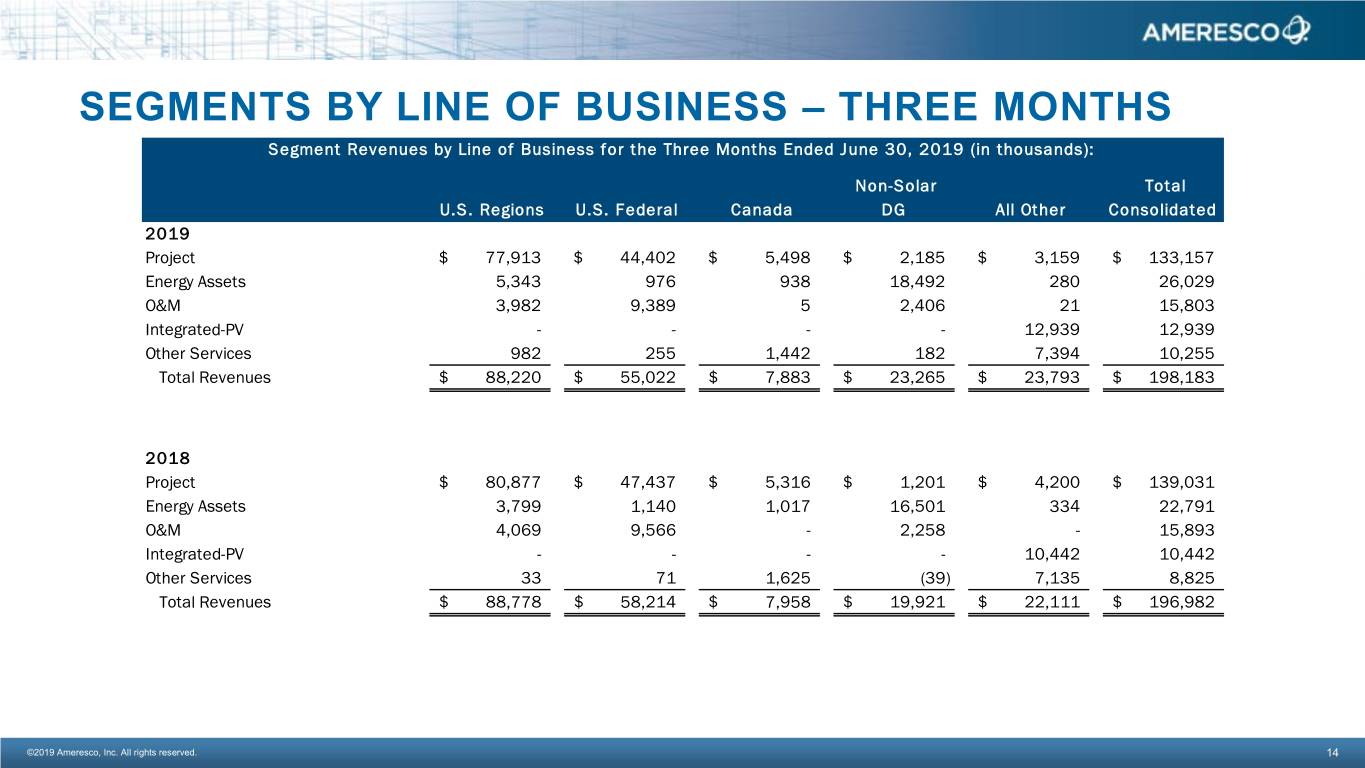
SEGMENTS BY LINE OF BUSINESS – THREE MONTHS Segment Revenues by Line of Business for the Three Months Ended June 30, 2019 (in thousands): Non-Solar Total U.S. Regions U.S. Federal Canada DG All Other Consolidated 2019 Project $ 77,913 $ 44,402 $ 5,498 $ 2,185 $ 3,159 $ 133,157 Energy Assets 5,343 976 938 18,492 280 26,029 O&M 3,982 9,389 5 2,406 21 15,803 Integrated-PV - - - - 12,939 12,939 Other Services 982 255 1,442 182 7,394 10,255 Total Revenues $ 88,220 $ 55,022 $ 7,883 $ 23,265 $ 23,793 $ 198,183 2018 Project $ 80,877 $ 47,437 $ 5,316 $ 1,201 $ 4,200 $ 139,031 Energy Assets 3,799 1,140 1,017 16,501 334 22,791 O&M 4,069 9,566 - 2,258 - 15,893 Integrated-PV - - - - 10,442 10,442 Other Services 33 71 1,625 (39) 7,135 8,825 Total Revenues $ 88,778 $ 58,214 $ 7,958 $ 19,921 $ 22,111 $ 196,982 ©2019 Ameresco, Inc. All rights reserved. 14
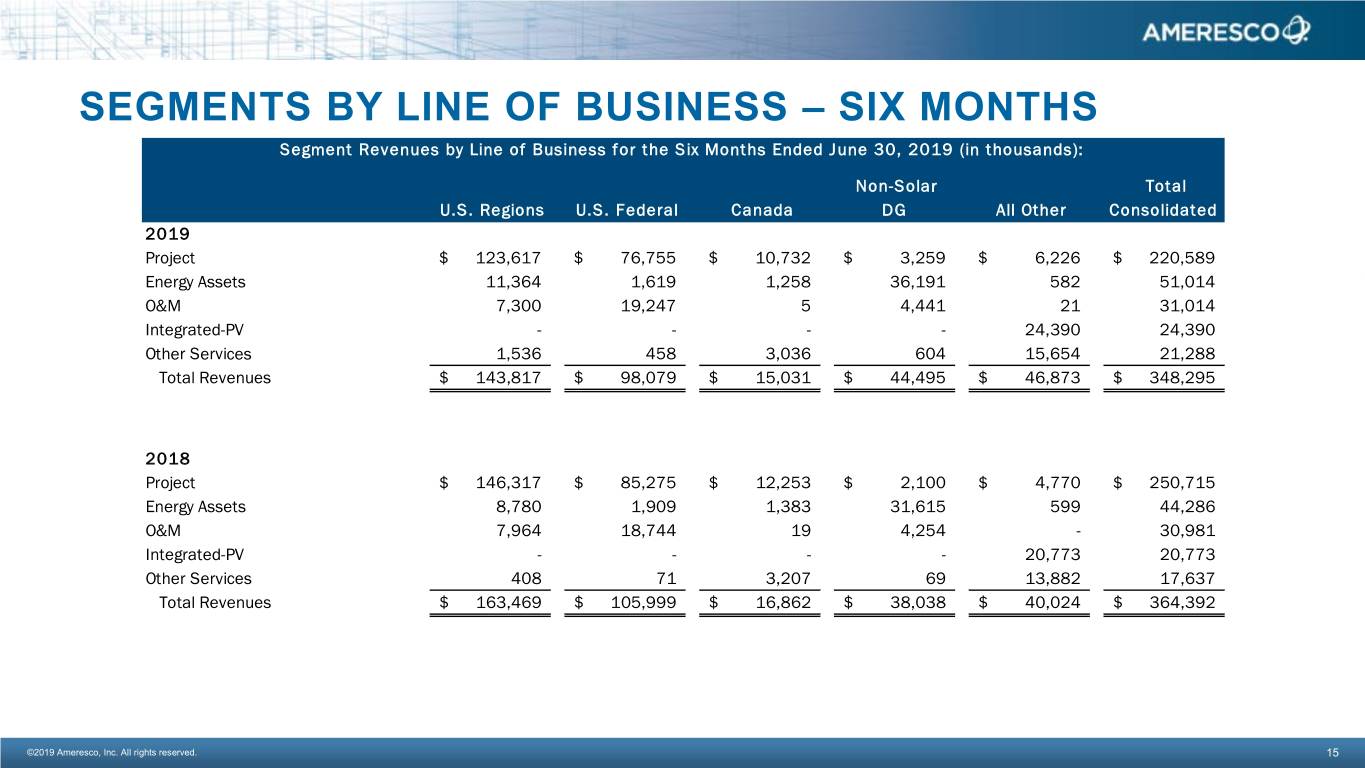
SEGMENTS BY LINE OF BUSINESS – SIX MONTHS Segment Revenues by Line of Business for the Six Months Ended June 30, 2019 (in thousands): Non-Solar Total U.S. Regions U.S. Federal Canada DG All Other Consolidated 2019 Project $ 123,617 $ 76,755 $ 10,732 $ 3,259 $ 6,226 $ 220,589 Energy Assets 11,364 1,619 1,258 36,191 582 51,014 O&M 7,300 19,247 5 4,441 21 31,014 Integrated-PV - - - - 24,390 24,390 Other Services 1,536 458 3,036 604 15,654 21,288 Total Revenues $ 143,817 $ 98,079 $ 15,031 $ 44,495 $ 46,873 $ 348,295 2018 Project $ 146,317 $ 85,275 $ 12,253 $ 2,100 $ 4,770 $ 250,715 Energy Assets 8,780 1,909 1,383 31,615 599 44,286 O&M 7,964 18,744 19 4,254 - 30,981 Integrated-PV - - - - 20,773 20,773 Other Services 408 71 3,207 69 13,882 17,637 Total Revenues $ 163,469 $ 105,999 $ 16,862 $ 38,038 $ 40,024 $ 364,392 ©2019 Ameresco, Inc. All rights reserved. 15

Your Trusted Sustainability Partner ameresco.com