Q3 2019 SUPPLEMENTAL INFORMATION NOVEMBER 5, 2019
Forward Looking Statements Any statements in this presentation about future expectations, plans and prospects for Ameresco, Inc., including statements about market conditions, pipeline and backlog, as well as estimated future revenues and net income, and other statements containing the words “projects,” “believes,” “anticipates,” “plans,” “expects,” “will” and similar expressions, constitute forward-looking statements within the meaning of The Private Securities Litigation Reform Act of 1995. Actual results may differ materially from those indicated by such forward-looking statements as a result of various important factors, including the timing of, and ability to, enter into contracts for awarded projects on the terms proposed; the timing of work we do on projects where we recognize revenue on a percentage of completion basis, including the ability to perform under recently signed contracts without unusual delay; our ability to place solar assets into service as planned; demand for our energy efficiency and renewable energy solutions; our ability to arrange financing for our projects; changes in federal, state and local government policies and programs related to energy efficiency and renewable energy; the ability of customers to cancel or defer contracts included in our backlog; the effects of our recent acquisitions and restructuring activities; seasonality in construction and in demand for our products and services; a customer’s decision to delay our work on, or other risks involved with, a particular project; availability and costs of labor and equipment; the addition of new customers or the loss of existing customers; market price of the Company's stock prevailing from time to time; the nature of other investment opportunities presented to the Company from time to time; the Company's cash flows from operations and other factors discussed in our Annual Report on Form 10-K for the year ended December 31, 2018, filed with the U.S. Securities and Exchange Commission on March 8, 2019. In addition, the forward-looking statements included in this presentation represent our views as of the date of this presentation. We anticipate that subsequent events and developments will cause our views to change. However, while we may elect to update these forward-looking statements at some point in the future, we specifically disclaim any obligation to do so. These forward-looking statements should not be relied upon as representing our views as of any date subsequent to the date of this presentation. Use of Non-GAAP Financial Measures This presentation includes references to adjusted EBITDA, adjusted cash from operations, non-GAAP net income and non-GAAP earnings per share, which are non-GAAP financial measures. For a description of these non-GAAP financial measures, including the reasons management uses these measures, please see the section in the Appendix in this presentation titled “Non-GAAP Financial Measures”. For a reconciliation of these non-GAAP financial measures to the most directly comparable financial measures prepared in accordance with GAAP, please see the tables in the Appendix to this presentation titled “GAAP to Non- GAAP Reconciliation,” Non-GAAP Financial Guidance” and “Non-GAAP Financial Measures.” ©2019 Ameresco, Inc. All rights reserved. 2
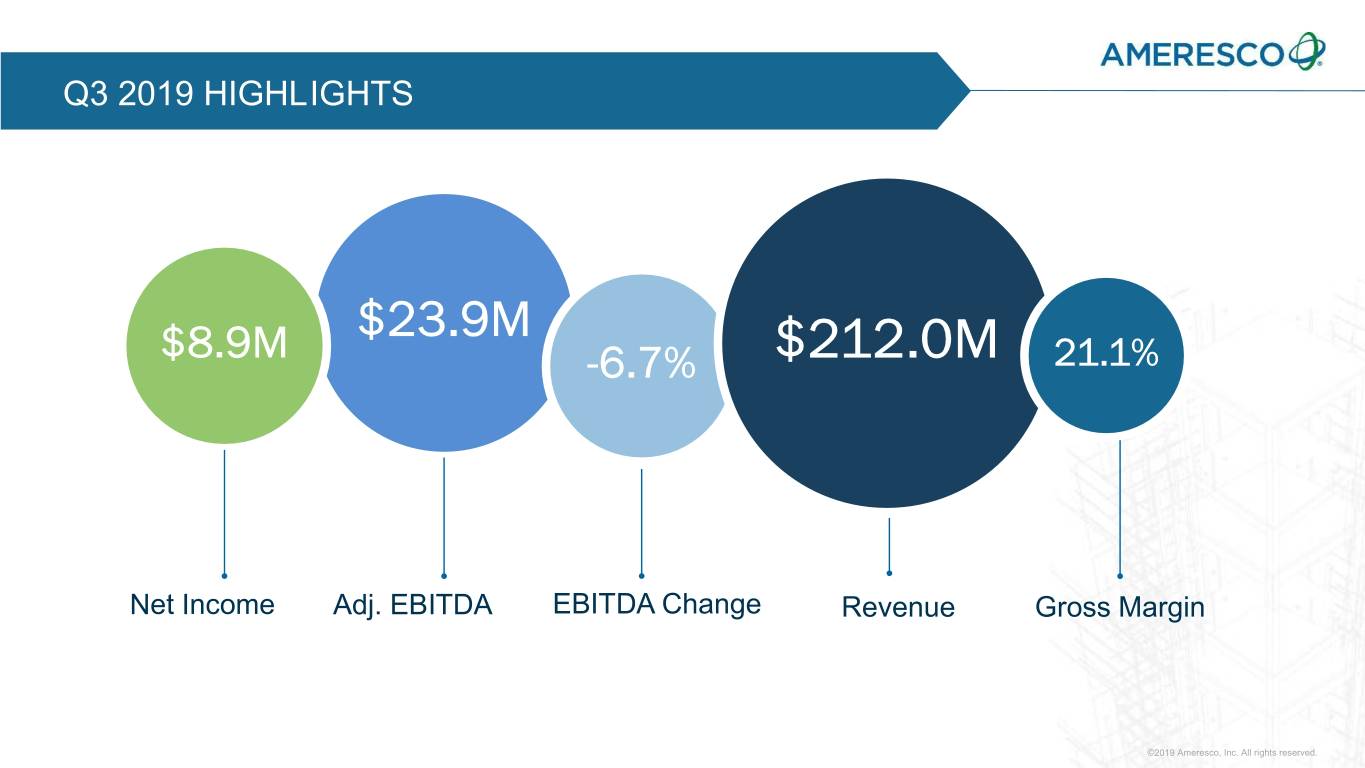
Q3 2019 HIGHLIGHTS $23.9M $8.9M -6.7% $212.0M 21.1% Net Income Adj. EBITDA EBITDA Change Revenue Gross Margin ©2019 Ameresco, Inc. All rights reserved.
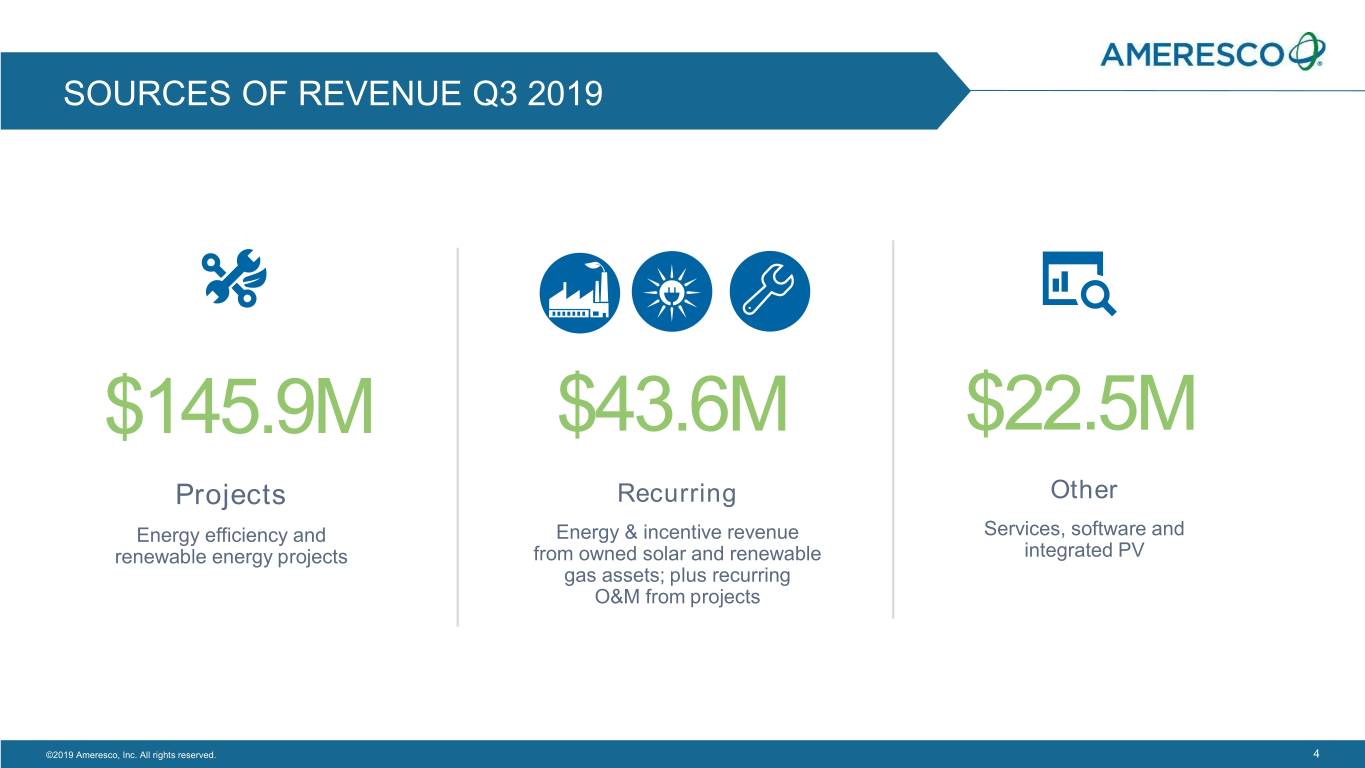
SOURCES OF REVENUE Q3 2019 $145.9M $43.6M $22.5M Projects Recurring Other Energy efficiency and Energy & incentive revenue Services, software and renewable energy projects from owned solar and renewable integrated PV gas assets; plus recurring O&M from projects ©2019 Ameresco, Inc. All rights reserved. 4
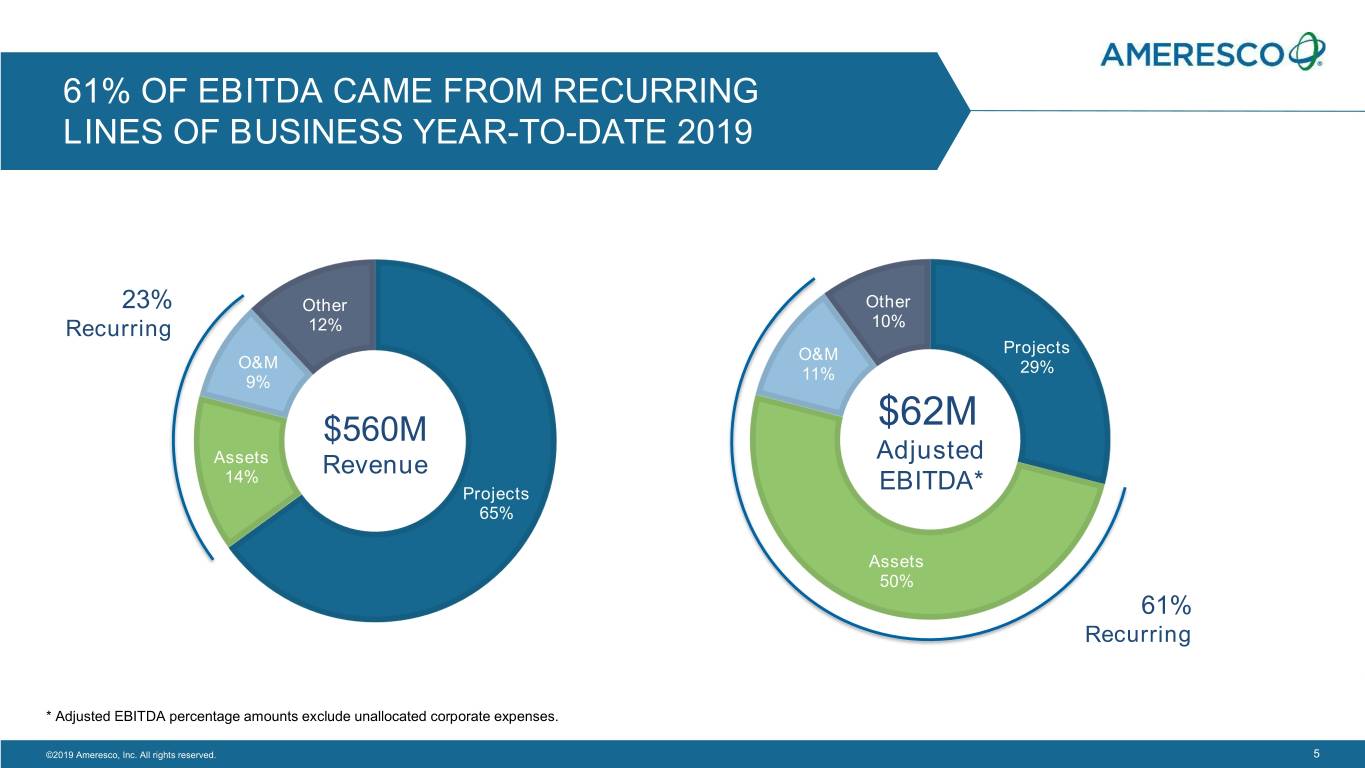
61% OF EBITDA CAME FROM RECURRING LINES OF BUSINESS YEAR-TO-DATE 2019 23% Other Other Recurring 12% 10% O&M Projects O&M 29% 9% 11% $560M $62M Assets Adjusted 14% Revenue Projects EBITDA* 65% Assets 50% 61% Recurring * Adjusted EBITDA percentage amounts exclude unallocated corporate expenses. ©2019 Ameresco, Inc. All rights reserved. 5
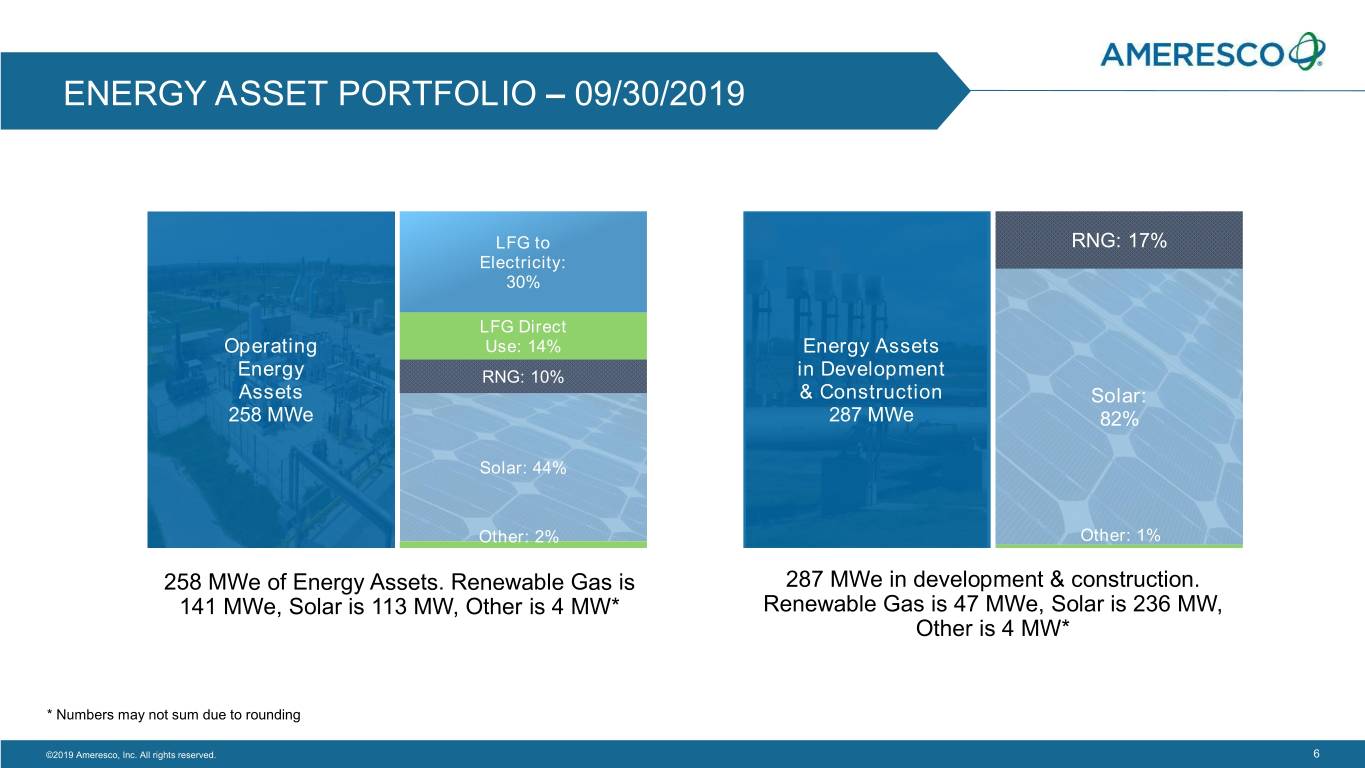
ENERGY ASSET PORTFOLIO – 09/30/2019 LFG to RNG: 17% Electricity: 30% LFG Direct Operating Use: 14% Energy Assets Energy RNG: 10% in Development Assets & Construction Solar: 258 MWe 287 MWe 82% Solar: 44% Other: 2% Other: 1% 258 MWe of Energy Assets. Renewable Gas is 287 MWe in development & construction. 141 MWe, Solar is 113 MW, Other is 4 MW* Renewable Gas is 47 MWe, Solar is 236 MW, Other is 4 MW* * Numbers may not sum due to rounding ©2019 Ameresco, Inc. All rights reserved. 6
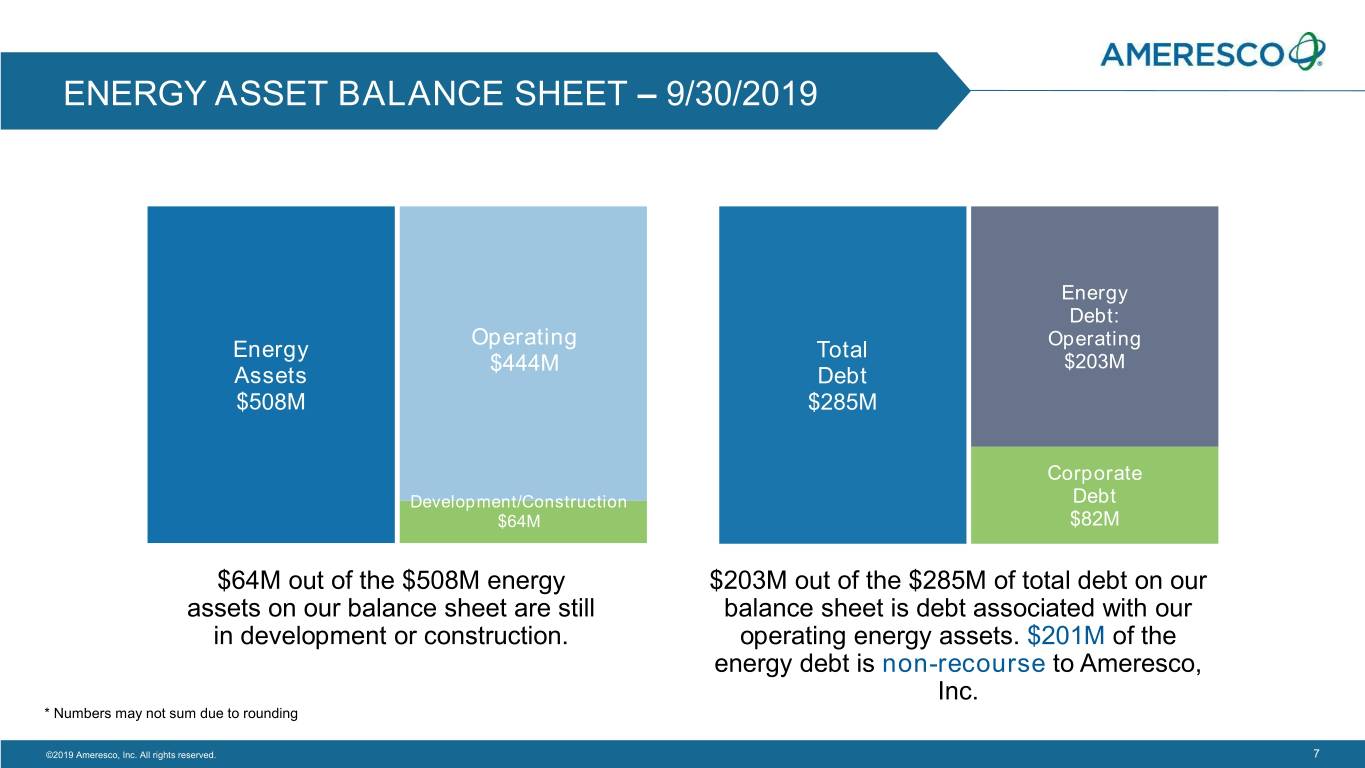
ENERGY ASSET BALANCE SHEET – 9/30/2019 Energy Debt: Operating Energy Total Operating $444M $203M Assets Debt $508M $285M Corporate Development/Construction Debt $64M $82M $64M out of the $508M energy $203M out of the $285M of total debt on our assets on our balance sheet are still balance sheet is debt associated with our in development or construction. operating energy assets. $201M of the energy debt is non-recourse to Ameresco, Inc. * Numbers may not sum due to rounding ©2019 Ameresco, Inc. All rights reserved. 7
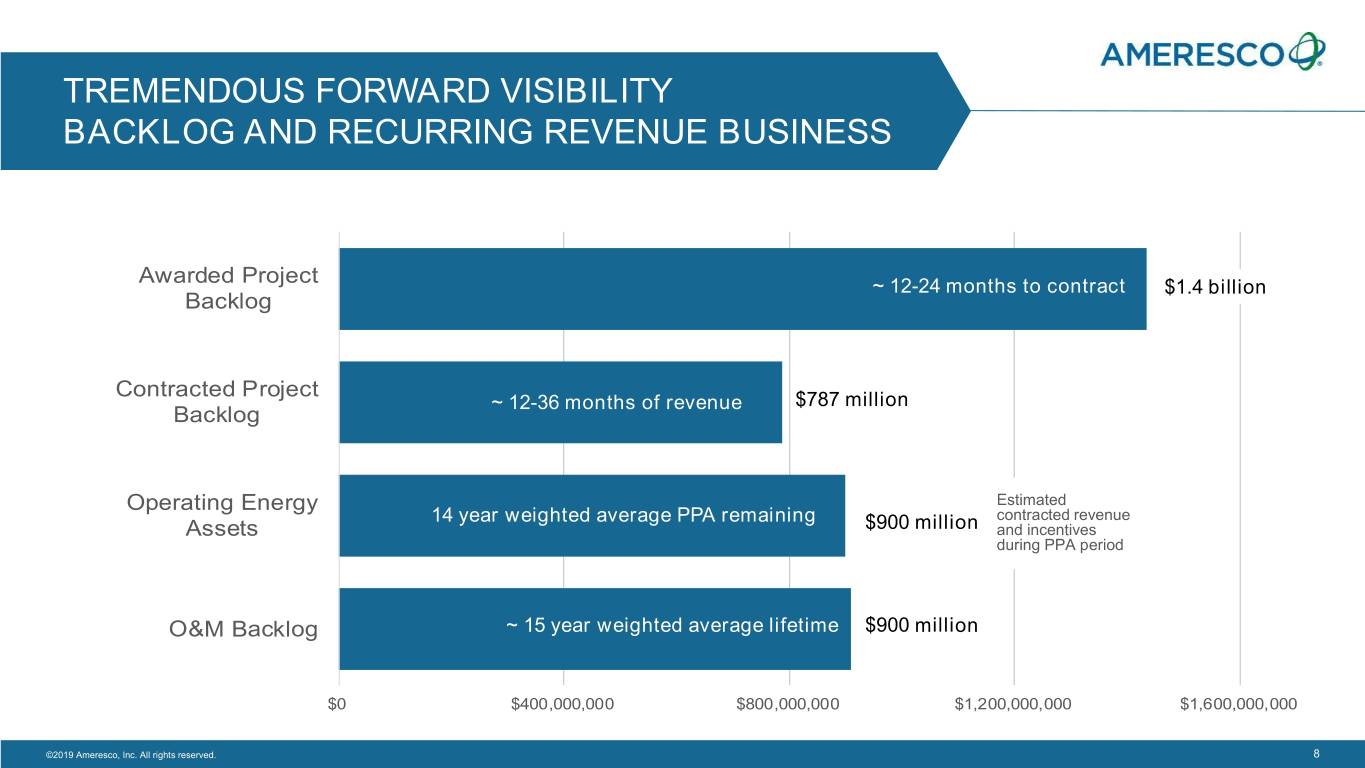
TREMENDOUS FORWARD VISIBILITY BACKLOG AND RECURRING REVENUE BUSINESS Awarded Project ~ 12-24 months to contract $1.4 billion Backlog Contracted Project ~ 12-36 months of revenue $787 million Backlog Operating Energy Estimated 14 year weighted average PPA remaining contracted revenue Assets $900 million and incentives during PPA period O&M Backlog ~ 15 year weighted average lifetime $900 million $0 $400,000,000 $800,000,000 $1,200,000,000 $1,600,000,000 ©2019 Ameresco, Inc. All rights reserved. 8
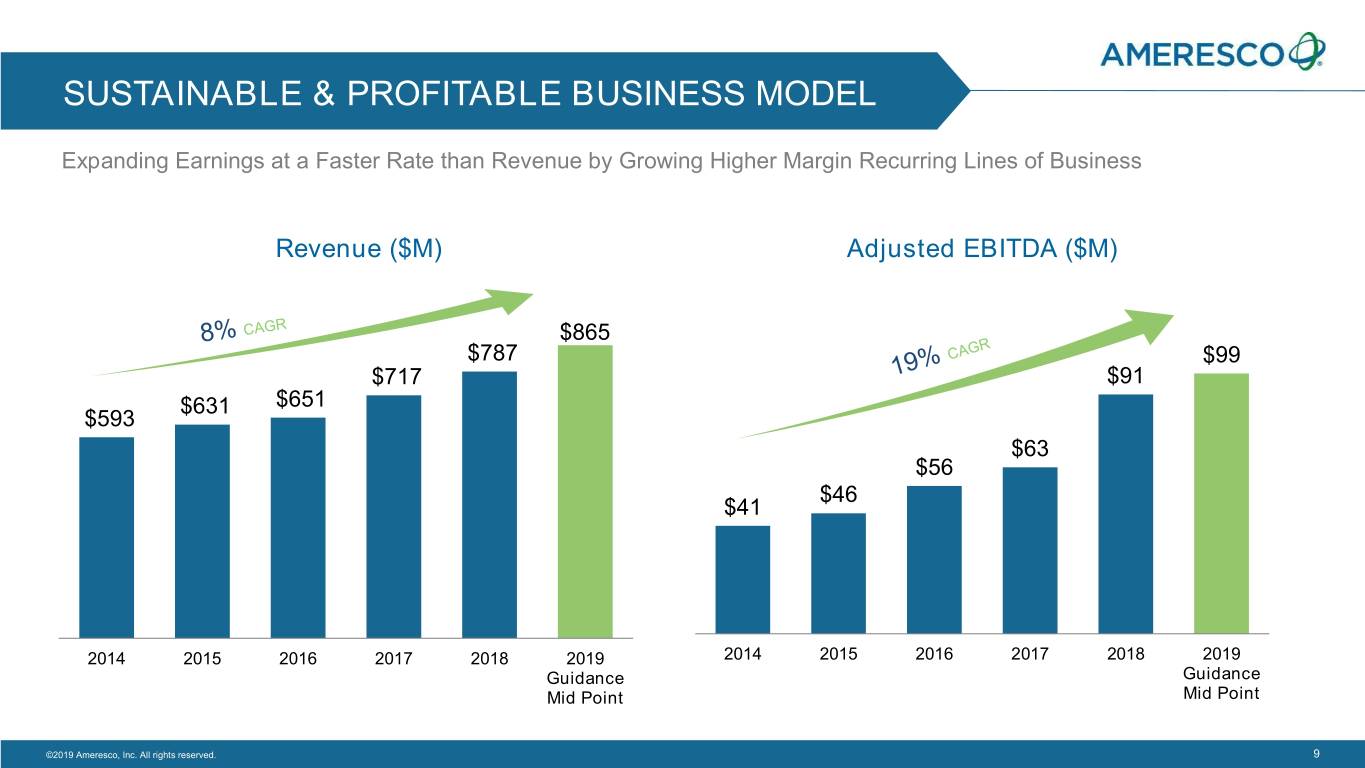
SUSTAINABLE & PROFITABLE BUSINESS MODEL Expanding Earnings at a Faster Rate than Revenue by Growing Higher Margin Recurring Lines of Business Revenue ($M) Adjusted EBITDA ($M) $865 $787 $99 $717 $91 $631 $651 $593 $63 $56 $46 $41 2014 2015 2016 2017 2018 2019 2014 2015 2016 2017 2018 2019 Guidance Guidance Mid Point Mid Point Guidance reaffirmed August 9, 2017 ©2019 Ameresco, Inc. All rights reserved. 9
APPENDIX
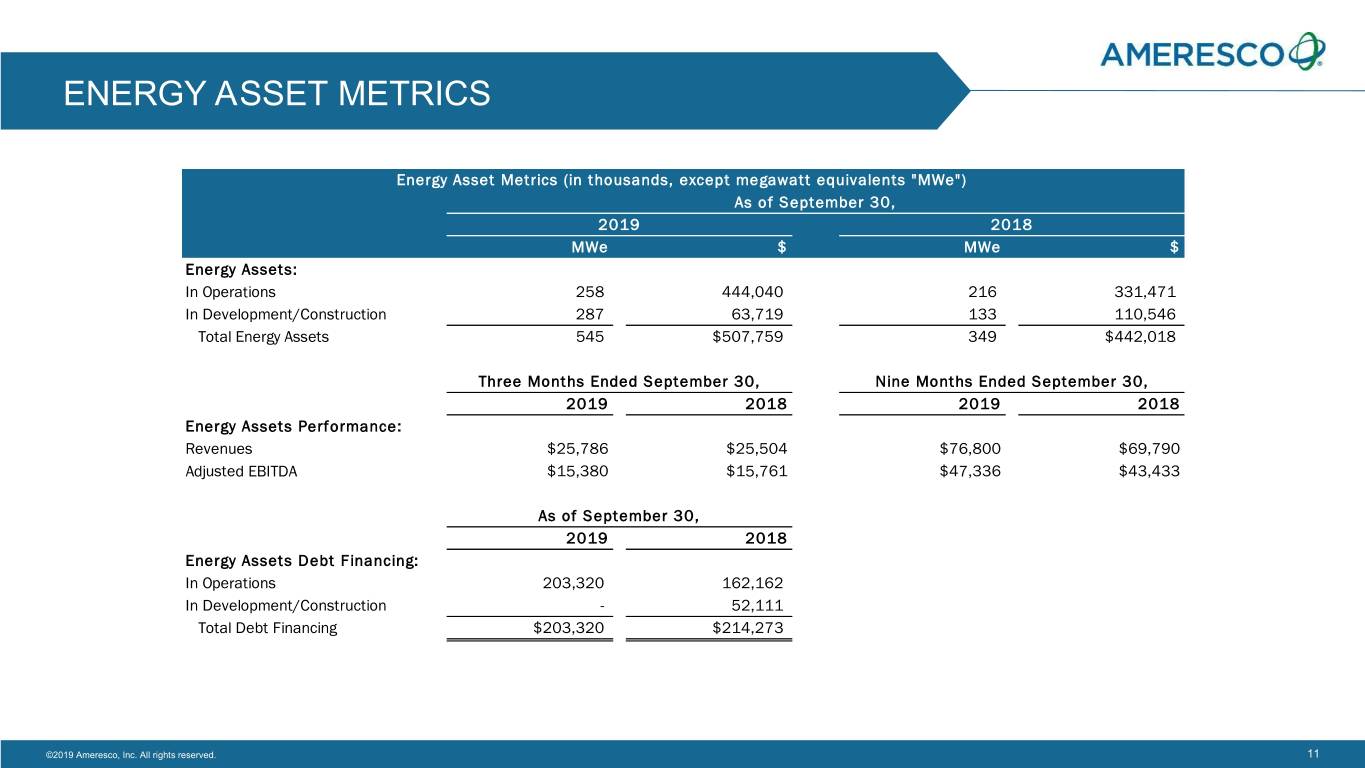
ENERGY ASSET METRICS Energy Asset Metrics (in thousands, except megawatt equivalents "MWe") As of September 30, 2019 2018 MWe $ MWe $ Energy Assets: In Operations 258 444,040 216 331,471 In Development/Construction 287 63,719 133 110,546 Total Energy Assets 545 $507,759 349 $442,018 Three Months Ended September 30, Nine Months Ended September 30, 2019 2018 2019 2018 Energy Assets Performance: Revenues $25,786 $25,504 $76,800 $69,790 Adjusted EBITDA $15,380 $15,761 $47,336 $43,433 As of September 30, 2019 2018 Energy Assets Debt Financing: In Operations 203,320 162,162 In Development/Construction - 52,111 Total Debt Financing $203,320 $214,273 ©2019 Ameresco, Inc. All rights reserved. 11
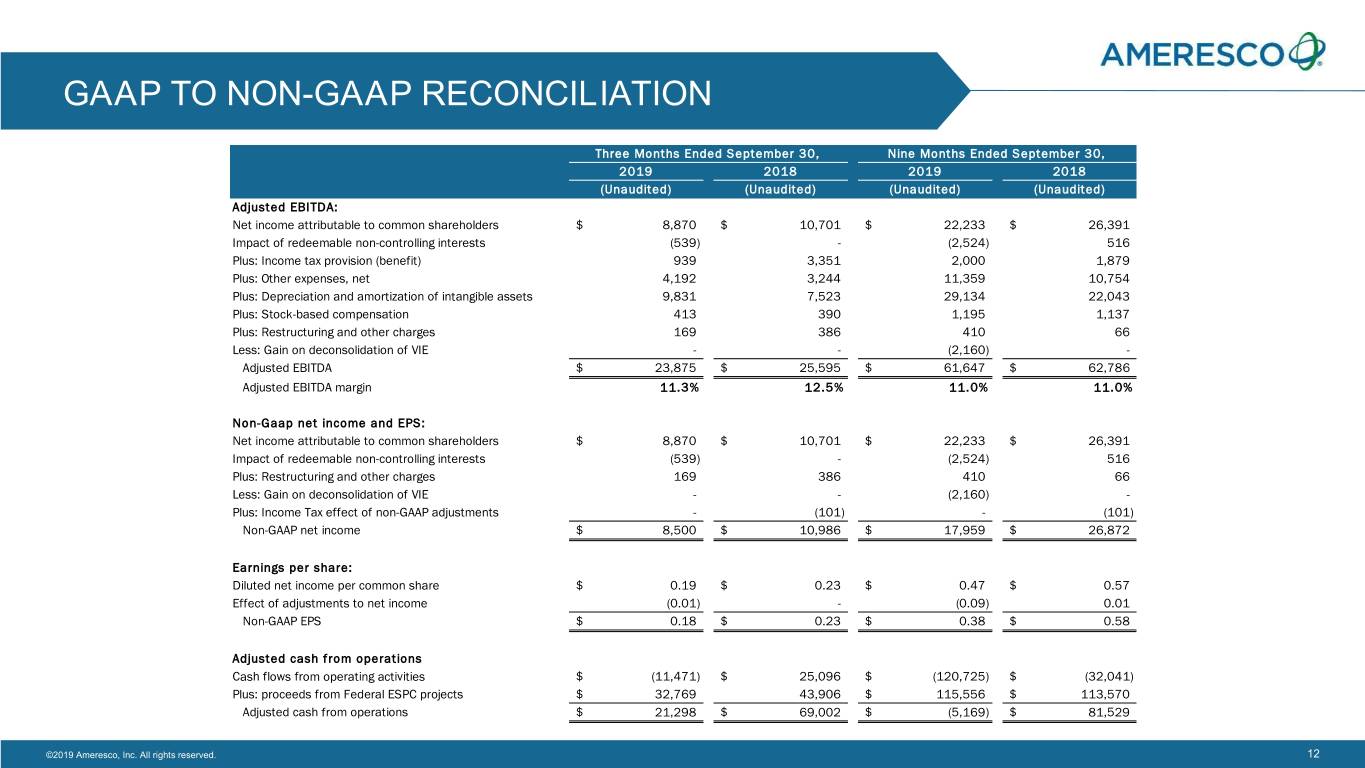
GAAP TO NON-GAAP RECONCILIATION Three Months Ended September 30, Nine Months Ended September 30, 2019 2018 2019 2018 (Unaudited) (Unaudited) (Unaudited) (Unaudited) Adjusted EBITDA: Net income attributable to common shareholders $ 8,870 $ 10,701 $ 22,233 $ 26,391 Impact of redeemable non-controlling interests (539) - (2,524) 516 Plus: Income tax provision (benefit) 939 3,351 2,000 1,879 Plus: Other expenses, net 4,192 3,244 11,359 10,754 Plus: Depreciation and amortization of intangible assets 9,831 7,523 29,134 22,043 Plus: Stock-based compensation 413 390 1,195 1,137 Plus: Restructuring and other charges 169 386 410 66 Less: Gain on deconsolidation of VIE - - (2,160) - Adjusted EBITDA $ 23,875 $ 25,595 $ 61,647 $ 62,786 Adjusted EBITDA margin 11.3% 12.5% 11.0% 11.0% Revenue 212,027 205,376 560,322 569,767 Non-Gaap net income and EPS: Net income attributable to common shareholders $ 8,870 $ 10,701 $ 22,233 $ 26,391 Impact of redeemable non-controlling interests (539) - (2,524) 516 Plus: Restructuring and other charges 169 386 410 66 Less: Gain on deconsolidation of VIE - - (2,160) - Plus: Income Tax effect of non-GAAP adjustments - (101) - (101) Non-GAAP net income $ 8,500 $ 10,986 $ 17,959 $ 26,872 Earnings per share: Diluted net income per common share $ 0.19 $ 0.23 $ 0.47 $ 0.57 Effect of adjustments to net income (0.01) - (0.09) 0.01 Non-GAAP EPS $ 0.18 $ 0.23 $ 0.38 $ 0.58 Adjusted cash from operations Cash flows from operating activities $ (11,471) $ 25,096 $ (120,725) $ (32,041) Plus: proceeds from Federal ESPC projects $ 32,769 43,906 $ 115,556 $ 113,570 Adjusted cash from operations $ 21,298 $ 69,002 $ (5,169) $ 81,529 ©2019 Ameresco, Inc. All rights reserved. 12
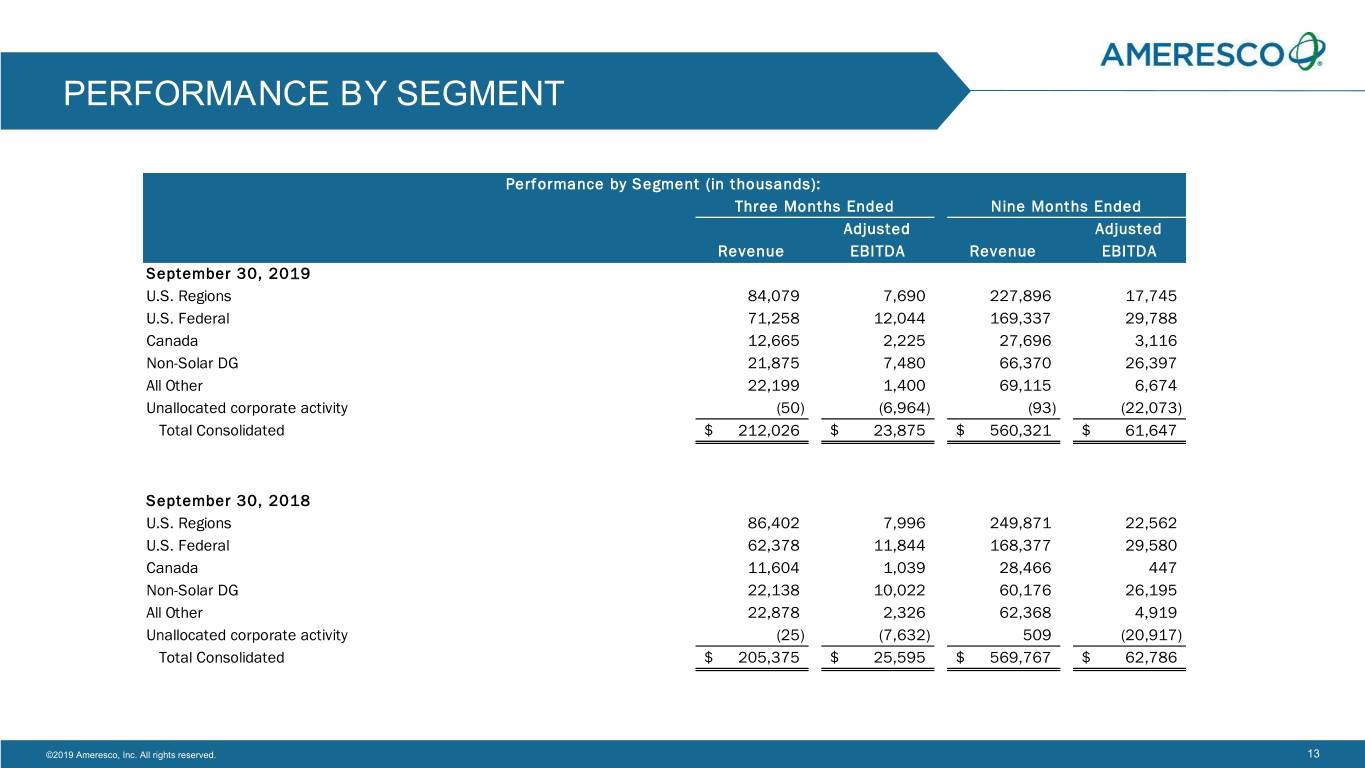
PERFORMANCE BY SEGMENT Performance by Segment (in thousands): Three Months Ended Nine Months Ended Adjusted Adjusted Revenue EBITDA Revenue EBITDA September 30, 2019 U.S. Regions 84,079 7,690 227,896 17,745 U.S. Federal 71,258 12,044 169,337 29,788 Canada 12,665 2,225 27,696 3,116 Non-Solar DG 21,875 7,480 66,370 26,397 All Other 22,199 1,400 69,115 6,674 Unallocated corporate activity (50) (6,964) (93) (22,073) Total Consolidated $ 212,026 $ 23,875 $ 560,321 $ 61,647 September 30, 2018 U.S. Regions 86,402 7,996 249,871 22,562 U.S. Federal 62,378 11,844 168,377 29,580 Canada 11,604 1,039 28,466 447 Non-Solar DG 22,138 10,022 60,176 26,195 All Other 22,878 2,326 62,368 4,919 Unallocated corporate activity (25) (7,632) 509 (20,917) Total Consolidated $ 205,375 $ 25,595 $ 569,767 $ 62,786 ©2019 Ameresco, Inc. All rights reserved. 13
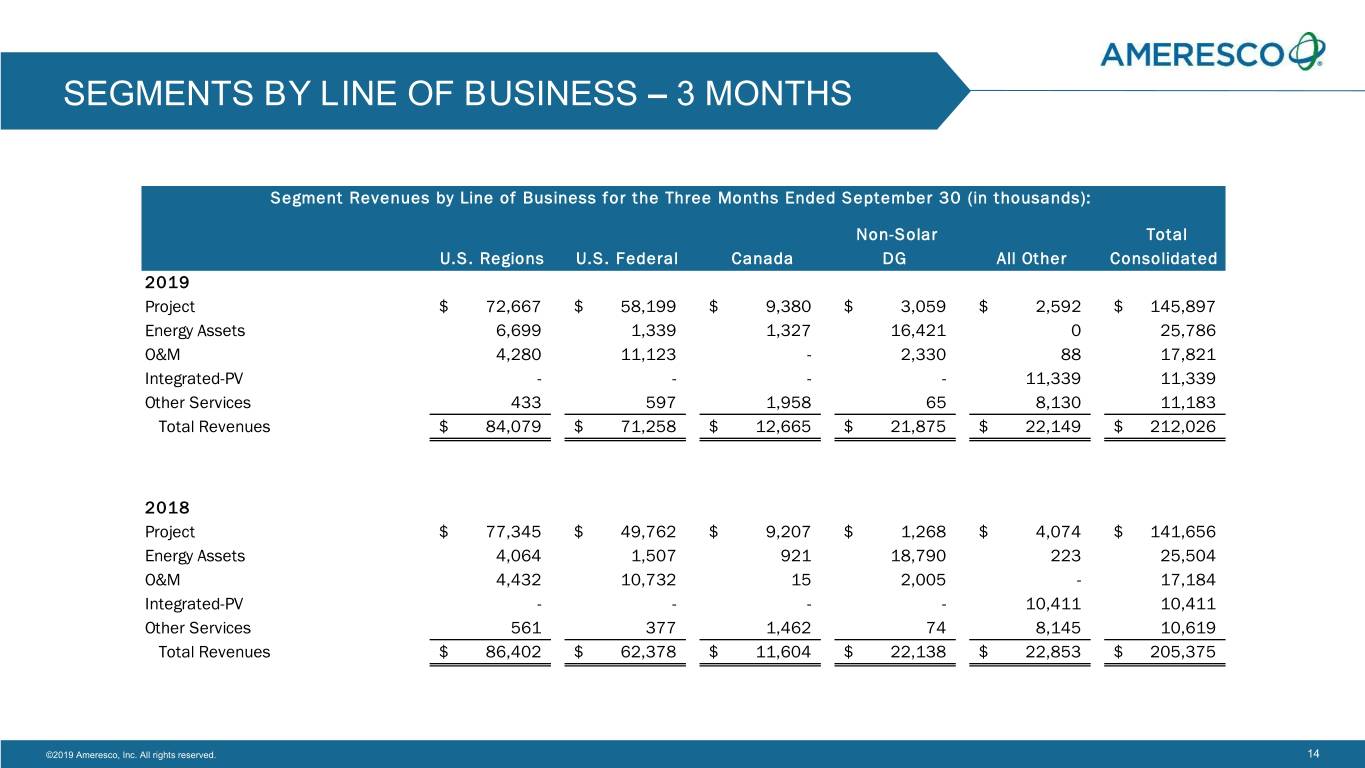
SEGMENTS BY LINE OF BUSINESS – 3 MONTHS Segment Revenues by Line of Business for the Three Months Ended September 30 (in thousands): Non-Solar Total U.S. Regions U.S. Federal Canada DG All Other Consolidated 2019 Project $ 72,667 $ 58,199 $ 9,380 $ 3,059 $ 2,592 $ 145,897 Energy Assets 6,699 1,339 1,327 16,421 0 25,786 O&M 4,280 11,123 - 2,330 88 17,821 Integrated-PV - - - - 11,339 11,339 Other Services 433 597 1,958 65 8,130 11,183 Total Revenues $ 84,079 $ 71,258 $ 12,665 $ 21,875 $ 22,149 $ 212,026 2018 Project $ 77,345 $ 49,762 $ 9,207 $ 1,268 $ 4,074 $ 141,656 Energy Assets 4,064 1,507 921 18,790 223 25,504 O&M 4,432 10,732 15 2,005 - 17,184 Integrated-PV - - - - 10,411 10,411 Other Services 561 377 1,462 74 8,145 10,619 Total Revenues $ 86,402 $ 62,378 $ 11,604 $ 22,138 $ 22,853 $ 205,375 ©2019 Ameresco, Inc. All rights reserved. 14
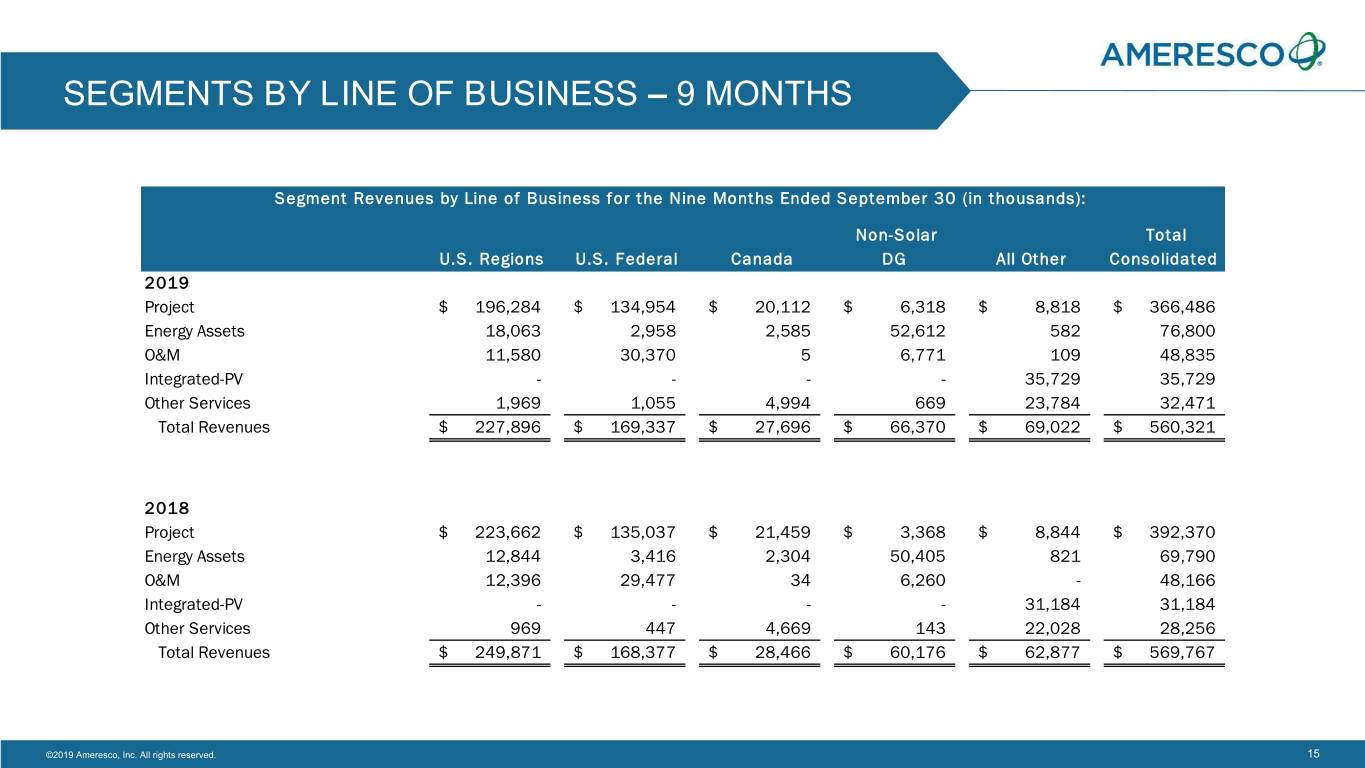
SEGMENTS BY LINE OF BUSINESS – 9 MONTHS Segment Revenues by Line of Business for the Nine Months Ended September 30 (in thousands): Non-Solar Total U.S. Regions U.S. Federal Canada DG All Other Consolidated 2019 Project $ 196,284 $ 134,954 $ 20,112 $ 6,318 $ 8,818 $ 366,486 Energy Assets 18,063 2,958 2,585 52,612 582 76,800 O&M 11,580 30,370 5 6,771 109 48,835 Integrated-PV - - - - 35,729 35,729 Other Services 1,969 1,055 4,994 669 23,784 32,471 Total Revenues $ 227,896 $ 169,337 $ 27,696 $ 66,370 $ 69,022 $ 560,321 2018 Project $ 223,662 $ 135,037 $ 21,459 $ 3,368 $ 8,844 $ 392,370 Energy Assets 12,844 3,416 2,304 50,405 821 69,790 O&M 12,396 29,477 34 6,260 - 48,166 Integrated-PV - - - - 31,184 31,184 Other Services 969 447 4,669 143 22,028 28,256 Total Revenues $ 249,871 $ 168,377 $ 28,466 $ 60,176 $ 62,877 $ 569,767 ©2019 Ameresco, Inc. All rights reserved. 15

Your Trusted Sustainability Partner ameresco.com