© 2 0 2 6 A m e r e s c o , I n c . A l l r i g h t s r e s e r v e d . ameresco.com Q2 2026 Supplemental Information August 3, 2026
Safe Harbor Forward Looking Statements This presentation contains forward-looking statements within the meaning of Section 21E of the Exchange Act, and Section 27A of the Securities Act. Statements that do not relate strictly to historical or current facts are forward-looking. Without limiting the generality of the foregoing, forward-looking statements contained herein specifically include expectations about market conditions, pipeline, visibility, backlog and conversion thereof, pending agreements, new and expanding market opportunities, financial guidance including estimated future revenues, net income, adjusted EBITDA, Non-GAAP EPS, gross margin, effective tax rate, interest rate, depreciation, tax attributes and capital investments; our expectations related to our agreement with SCE including the impact of delays and any requirement to pay liquidated damages, goals, strategies, investment objectives, plans and achievements and other statements containing the words “projects,” “believes,” “anticipates,” “plans,” “expects,” “will” and similar expressions .The forward-looking statements included herein involve risks and uncertainties that could cause actual results to differ materially from projected results. Accordingly, investors should not place undue reliance on forward-looking statements as a prediction of actual results. The Company has based these forward-looking statements on current expectations and assumptions about future events, taking into account all information currently known by the Company. While the Company considers these expectations and assumptions to be reasonable, they are inherently subject to significant business, economic, competitive, regulatory and other risks and uncertainties, many of which are difficult to predict and beyond the Company’s control. These risks and uncertainties include, but are not limited to: (i) demand for our energy efficiency and infrastructure solutions and our ability or inability to execute our strategic growth plan, including our ability to invest according to plan, grow our businesses (including through joint ventures or other co-investment vehicles and expand into new lines of business); (ii) the timing of, and ability to, enter into contracts for awarded projects on the terms proposed or at all; (iii) the timing of work we do on projects where we recognize revenue on a percentage of completion basis; (iv) the ability to perform under signed contracts without delay and in accordance with their terms and the potential for liquidated and other damages we may be subject to; (v) the fiscal health of the government and the impact of any government shutdowns; (vi) our ability to complete and operate our projects on a profitable basis and as committed to our customers; (vii) our cash flows from operations and our ability to arrange financing to fund our operations and projects; (viii) our customers’ ability to finance their projects and credit risk from our customers; (ix) our ability to comply with covenants in our existing debt agreements; (x) the impact of macroeconomic challenges, weather related events and climate change; (xi) our reliance on third parties for our construction and installation work; (xii) availability and cost of labor and equipment; (xiii) global supply chain challenges, component shortages and inflationary pressures; (xiv) changes in federal, state and local government policies and programs related to our business; (xv) the ability of customers to cancel or defer contracts included in our backlog; (xvi) the output and performance of our energy plants and energy projects; (xvii) cybersecurity incidents and breaches; (xviii) regulatory and other risks inherent to constructing and operating energy assets; (xix) the effects of and ability to close our acquisitions and joint ventures; (xx) seasonality in construction and in demand for our products and services; (xxi) a customer’s decision to delay our work on, or other risks involved with, a particular project; (xxii) the addition of new customers or the loss of existing customers; (xxiii) market price of our Class A Common stock prevailing from time to time; (xxiv) the nature of other investment opportunities presented to our Company from time to time; (xxv) risks related to our international operation and international growth strategy; and (xxvi) the other risks described in our periodic reports filed with the SEC, including under the caption “Risk Factors” in Part I, Item 1A of our Annual Report. Except as required by law, we undertake no obligation to update any forward-looking statements appearing in this presentation. Use of Non-GAAP Financial Measures This presentation and the accompanying tables include references to adjusted EBITDA, Non-GAAP EPS, Non-GAAP net income and adjusted cash from operations, which are Non-GAAP financial measures. For a description of these Non-GAAP financial measures, including the reasons management uses these measures, please see the section in the back of this presentation titled “Non-GAAP Financial Measures”. For a reconciliation of these Non-GAAP financial measures to the most directly comparable financial measures prepared in accordance with GAAP, please see the table at the end of this presentation titled “GAAP to Non- GAAP Reconciliation.” Other Definitions More details on additional definitions used herein, such as total project backlog, awarded backlog, contracted backlog, O&M backlog, 12-month backlog and assets in development are provided in our periodic reports filed with the SEC. 2
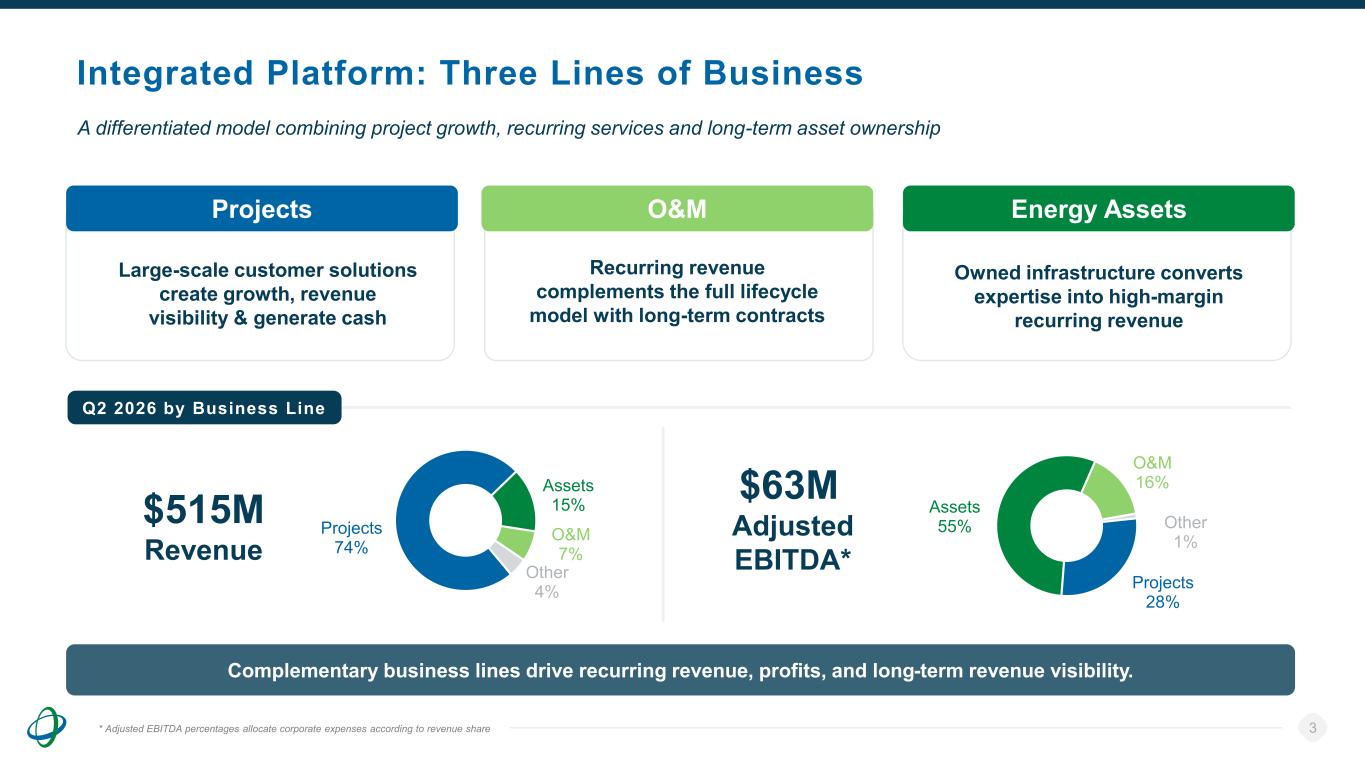
Integrated Platform: Three Lines of Business 3 A differentiated model combining project growth, recurring services and long-term asset ownership Complementary business lines drive recurring revenue, profits, and long-term revenue visibility. Projects O&M Energy Assets Large-scale customer solutions create growth, revenue visibility & generate cash Recurring revenue complements the full lifecycle model with long-term contracts Owned infrastructure converts expertise into high-margin recurring revenue * Adjusted EBITDA percentages allocate corporate expenses according to revenue share Q2 2026 by Business Line Projects 74% Assets 15% O&M 7% Other 4% Projects 28% Assets 55% O&M 16% Other 1% $515M Revenue $63M Adjusted EBITDA*
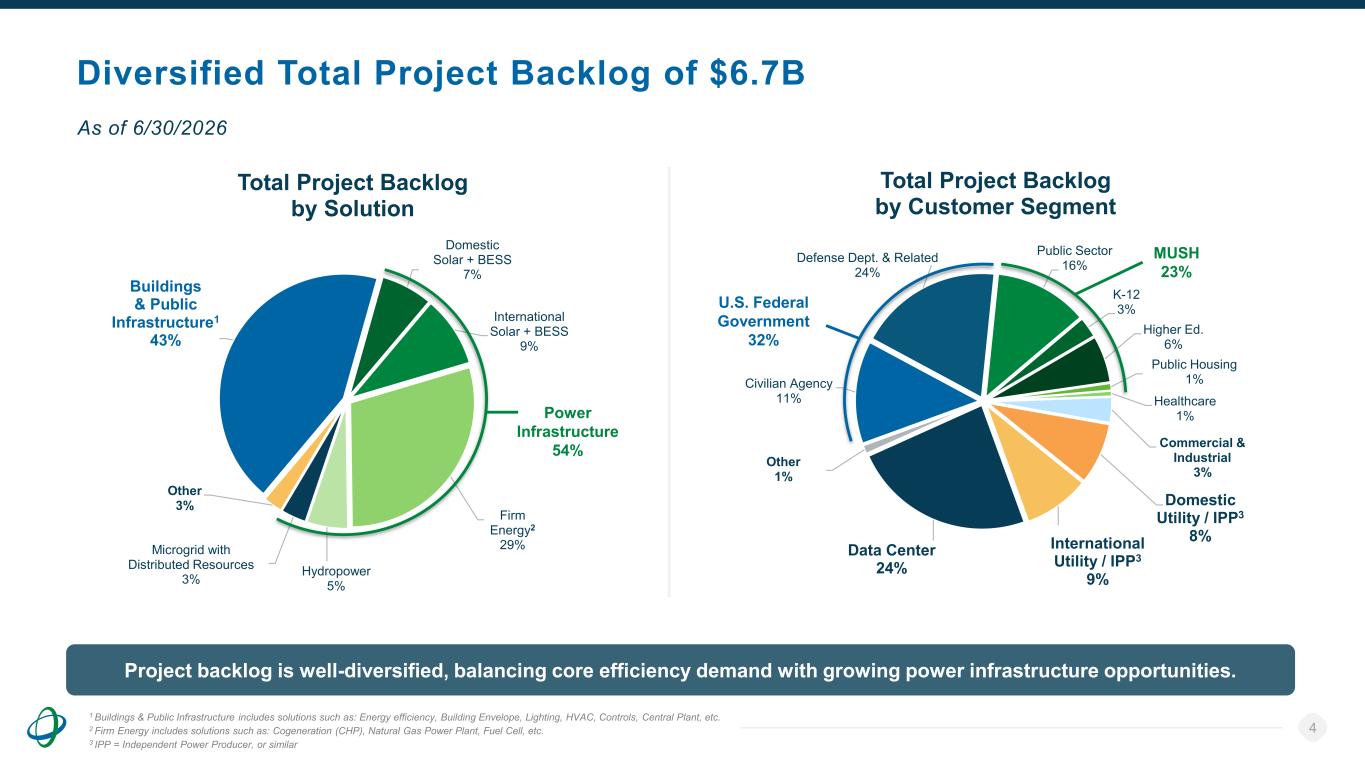
4 1 Buildings & Public Infrastructure includes solutions such as: Energy efficiency, Building Envelope, Lighting, HVAC, Controls, Central Plant, etc. 2 Firm Energy includes solutions such as: Cogeneration (CHP), Natural Gas Power Plant, Fuel Cell, etc. 3 IPP = Independent Power Producer, or similar Project backlog is well-diversified, balancing core efficiency demand with growing power infrastructure opportunities. Diversified Total Project Backlog of $6.7B As of 6/30/2026 Buildings & Public Infrastructure1 43% Domestic Solar + BESS 7% International Solar + BESS 9% Firm Energy2 29% Hydropower 5% Microgrid with Distributed Resources 3% Other 3% Total Project Backlog by Solution Power Infrastructure 54% Civilian Agency 11% Defense Dept. & Related 24% Public Sector 16% K-12 3% Higher Ed. 6% Public Housing 1% Healthcare 1% Commercial & Industrial 3% Domestic Utility / IPP3 8% International Utility / IPP3 9% Data Center 24% Other 1% Total Project Backlog by Customer Segment U.S. Federal Government 32% MUSH 23%
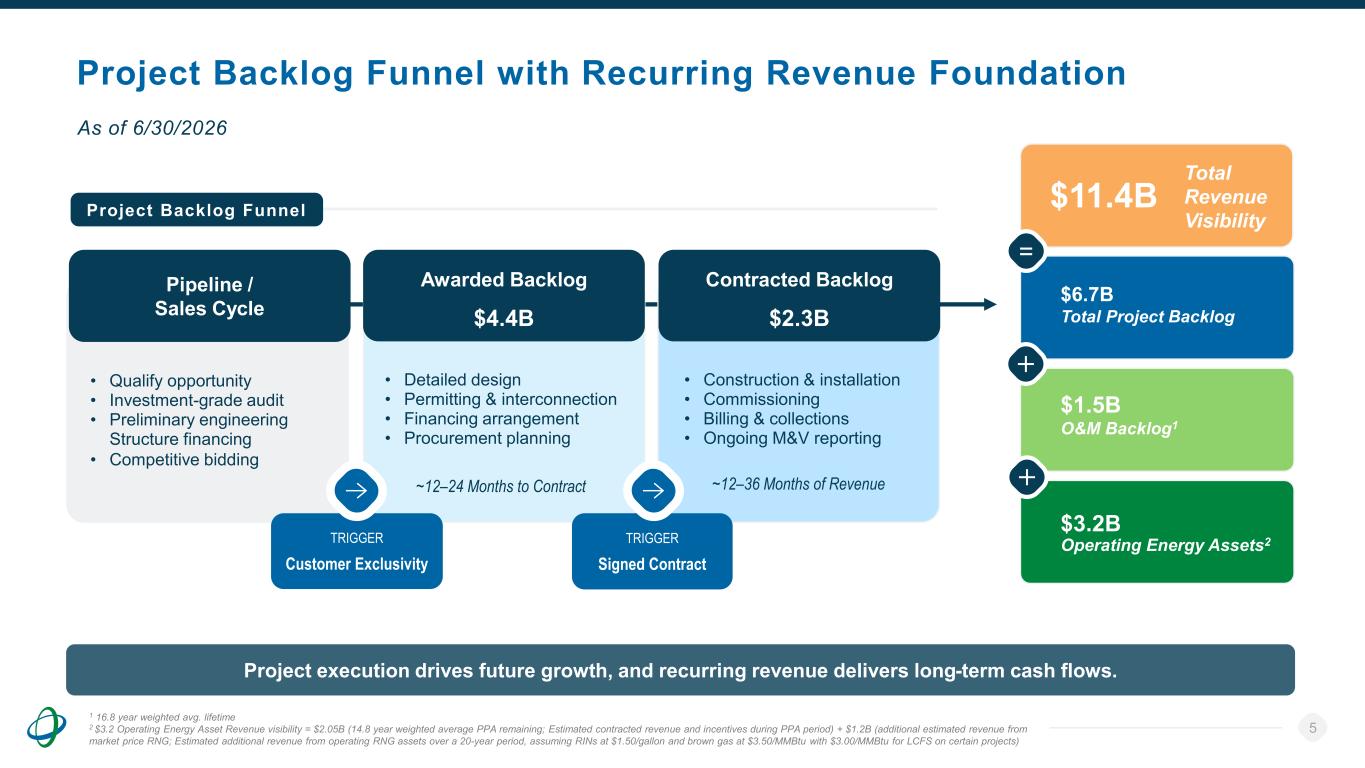
Project Backlog Funnel with Recurring Revenue Foundation 5 As of 6/30/2026 Project execution drives future growth, and recurring revenue delivers long-term cash flows. Awarded Backlog $4.4B Contracted Backlog $2.3B TRIGGER Customer Exclusivity TRIGGER Signed Contract • Qualify opportunity • Investment-grade audit • Preliminary engineering Structure financing • Competitive bidding • Detailed design • Permitting & interconnection • Financing arrangement • Procurement planning • Construction & installation • Commissioning • Billing & collections • Ongoing M&V reporting Pipeline / Sales Cycle Project Backlog Funnel $6.7B Total Project Backlog $1.5B O&M Backlog1 $11.4B $3.2B Operating Energy Assets2 1 16.8 year weighted avg. lifetime 2 $3.2 Operating Energy Asset Revenue visibility = $2.05B (14.8 year weighted average PPA remaining; Estimated contracted revenue and incentives during PPA period) + $1.2B (additional estimated revenue from market price RNG; Estimated additional revenue from operating RNG assets over a 20-year period, assuming RINs at $1.50/gallon and brown gas at $3.50/MMBtu with $3.00/MMBtu for LCFS on certain projects) = Total Revenue Visibility ~12–24 Months to Contract ~12–36 Months of Revenue
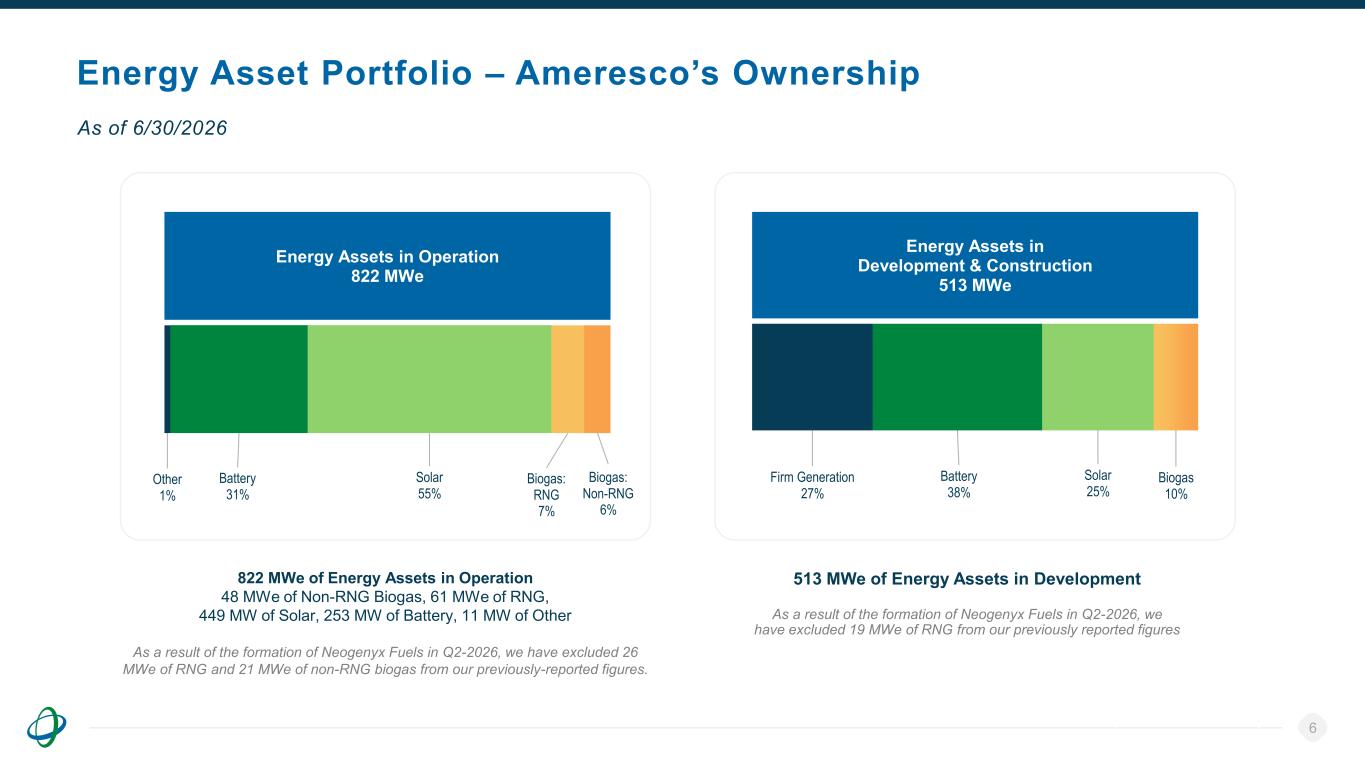
Energy Asset Portfolio – Ameresco’s Ownership 6 As of 6/30/2026 Numbers may not sum due to rounding 822 MWe of Energy Assets in Operation 48 MWe of Non-RNG Biogas, 61 MWe of RNG, 449 MW of Solar, 253 MW of Battery, 11 MW of Other As a result of the formation of Neogenyx Fuels in Q2-2026, we have excluded 26 MWe of RNG and 21 MWe of non-RNG biogas from our previously-reported figures. 513 MWe of Energy Assets in Development As a result of the formation of Neogenyx Fuels in Q2-2026, we have excluded 19 MWe of RNG from our previously reported figures Energy Assets in Operation 822 MWe Other 1% Battery 31% Solar 55% Biogas: RNG 7% Biogas: Non-RNG 6% Energy Assets in Development & Construction 513 MWe Firm Generation 27% Battery 38% Solar 25% Biogas 10%
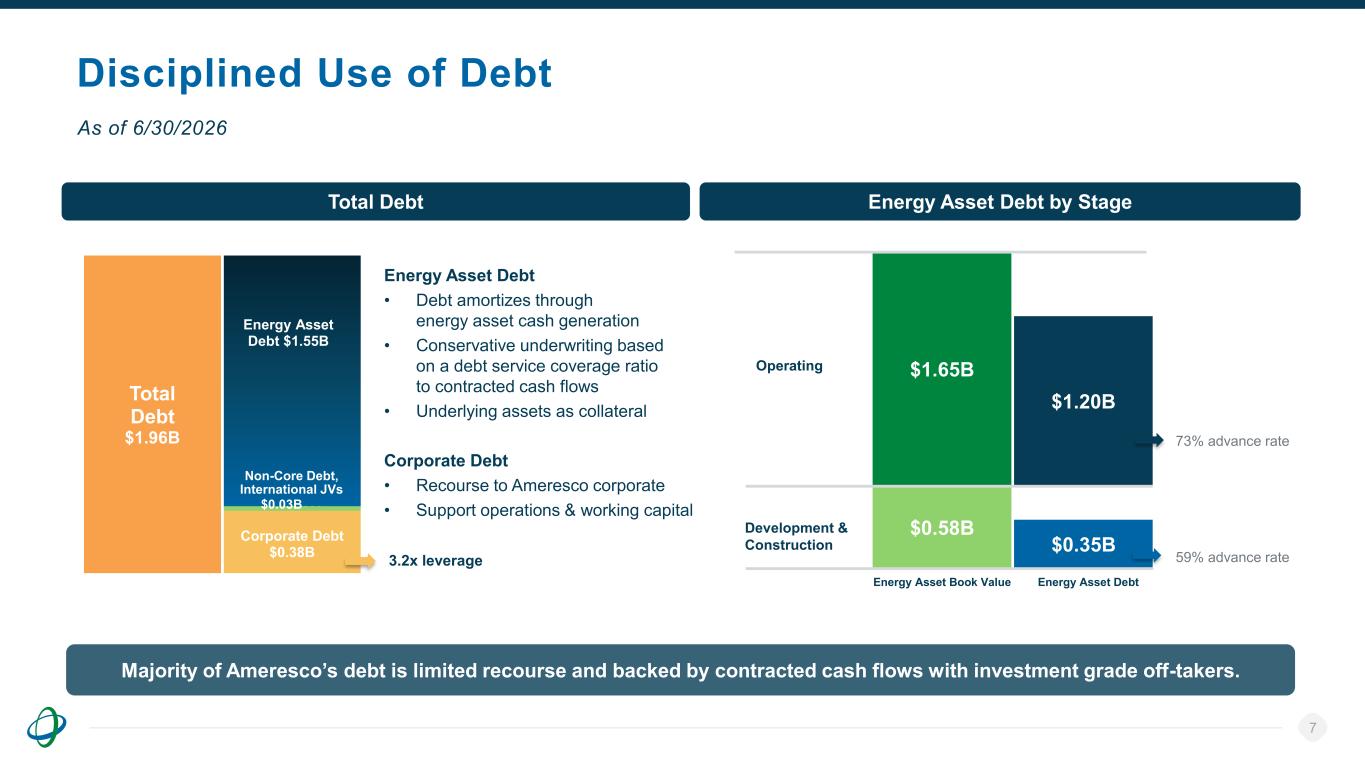
Disciplined Use of Debt 7 As of 6/30/2026 Total Debt Energy Asset Debt by Stage Energy Asset Debt • Debt amortizes through energy asset cash generation • Conservative underwriting based on a debt service coverage ratio to contracted cash flows • Underlying assets as collateral Corporate Debt • Recourse to Ameresco corporate • Support operations & working capital Majority of Ameresco’s debt is limited recourse and backed by contracted cash flows with investment grade off-takers. Total Debt $1.96B Corporate Debt $0.38B Non-Core Debt, International JVs $0.03B… Energy Asset Debt $1.55B 3.2x leverage $0.58B $0.35B $1.65B $1.20B Energy Asset Book Value Energy Asset Debt 73% advance rate Operating Development & Construction 59% advance rate
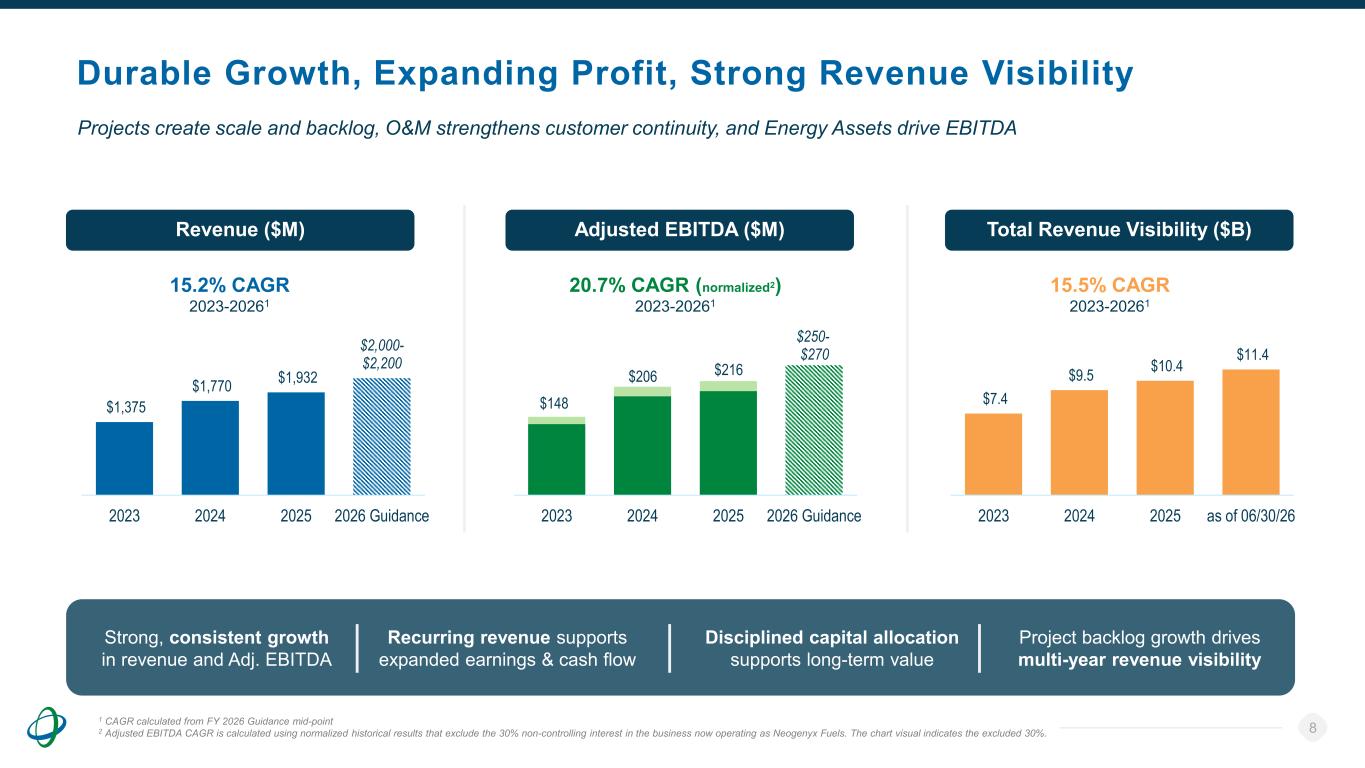
Durable Growth, Expanding Profit, Strong Revenue Visibility 8 Projects create scale and backlog, O&M strengthens customer continuity, and Energy Assets drive EBITDA Revenue ($M) Adjusted EBITDA ($M) Total Revenue Visibility ($B) Strong, consistent growth in revenue and Adj. EBITDA Project backlog growth drives multi-year revenue visibility Recurring revenue supports expanded earnings & cash flow Disciplined capital allocation supports long-term value 1 CAGR calculated from FY 2026 Guidance mid-point 2 Adjusted EBITDA CAGR is calculated using normalized historical results that exclude the 30% non-controlling interest in the business now operating as Neogenyx Fuels. The chart visual indicates the excluded 30%. $148 $206 $216 $250- $270 2023 2024 2025 2026 Guidance $1,375 $1,770 $1,932 $2,000- $2,200 2023 2024 2025 2026 Guidance $7.4 $9.5 $10.4 $11.4 2023 2024 2025 as of 06/30/26 15.2% CAGR 2023-20261 20.7% CAGR (normalized2) 2023-20261 15.5% CAGR 2023-20261
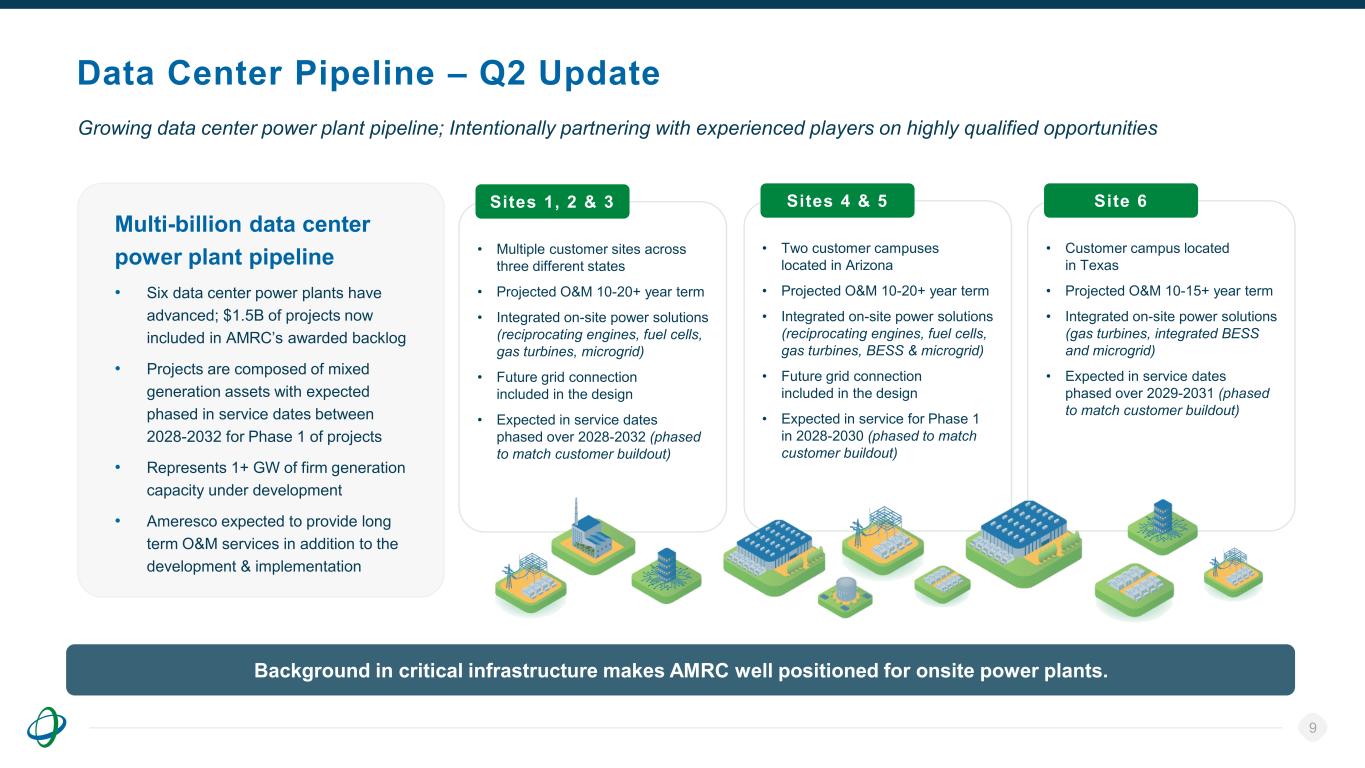
Data Center Pipeline – Q2 Update 9 Growing data center power plant pipeline; Intentionally partnering with experienced players on highly qualified opportunities Background in critical infrastructure makes AMRC well positioned for onsite power plants. • Multiple customer sites across three different states • Projected O&M 10-20+ year term • Integrated on-site power solutions (reciprocating engines, fuel cells, gas turbines, microgrid) • Future grid connection included in the design • Expected in service dates phased over 2028-2032 (phased to match customer buildout) Sites 1, 2 & 3 Multi-billion data center power plant pipeline • Six data center power plants have advanced; $1.5B of projects now included in AMRC’s awarded backlog • Projects are composed of mixed generation assets with expected phased in service dates between 2028-2032 for Phase 1 of projects • Represents 1+ GW of firm generation capacity under development • Ameresco expected to provide long term O&M services in addition to the development & implementation • Two customer campuses located in Arizona • Projected O&M 10-20+ year term • Integrated on-site power solutions (reciprocating engines, fuel cells, gas turbines, BESS & microgrid) • Future grid connection included in the design • Expected in service for Phase 1 in 2028-2030 (phased to match customer buildout) Sites 4 & 5 • Customer campus located in Texas • Projected O&M 10-15+ year term • Integrated on-site power solutions (gas turbines, integrated BESS and microgrid) • Expected in service dates phased over 2029-2031 (phased to match customer buildout) Site 6
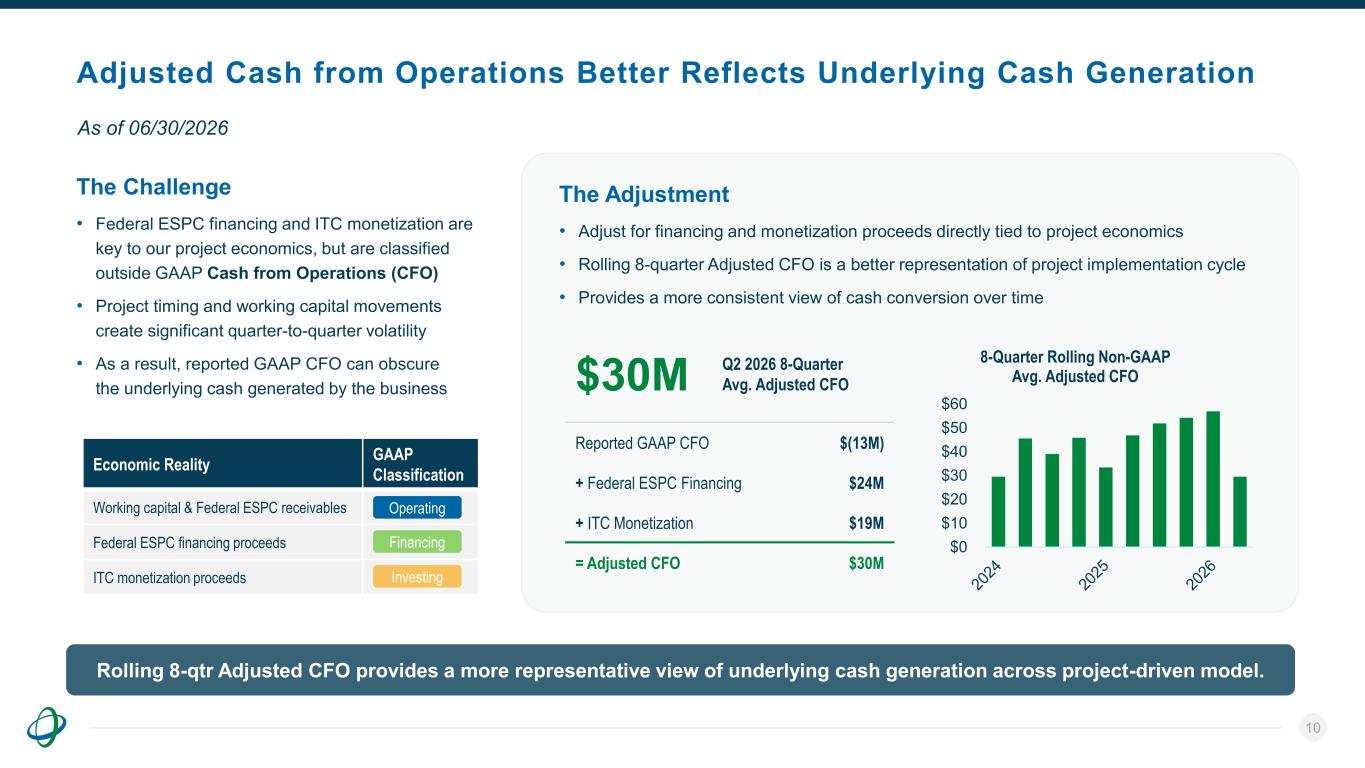
Adjusted Cash from Operations Better Reflects Underlying Cash Generation 10 The Challenge • Federal ESPC financing and ITC monetization are key to our project economics, but are classified outside GAAP Cash from Operations (CFO) • Project timing and working capital movements create significant quarter-to-quarter volatility • As a result, reported GAAP CFO can obscure the underlying cash generated by the business As of 06/30/2026 Rolling 8-qtr Adjusted CFO provides a more representative view of underlying cash generation across project-driven model. Economic Reality GAAP Classification Working capital & Federal ESPC receivables Operating Federal ESPC financing proceeds Financing ITC monetization proceeds Investing The Adjustment • Adjust for financing and monetization proceeds directly tied to project economics • Rolling 8-quarter Adjusted CFO is a better representation of project implementation cycle • Provides a more consistent view of cash conversion over time Operating Fi a cing Investing $0 $10 $20 $30 $40 $50 $60 8-Quarter Rolling Non-GAAP Avg. Adjusted CFO$30M Q2 2026 8-Quarter Avg. Adjusted CFO Reported GAAP CFO $(13M) + Federal ESPC Financing $24M + ITC Monetization $19M = Adjusted CFO $30M
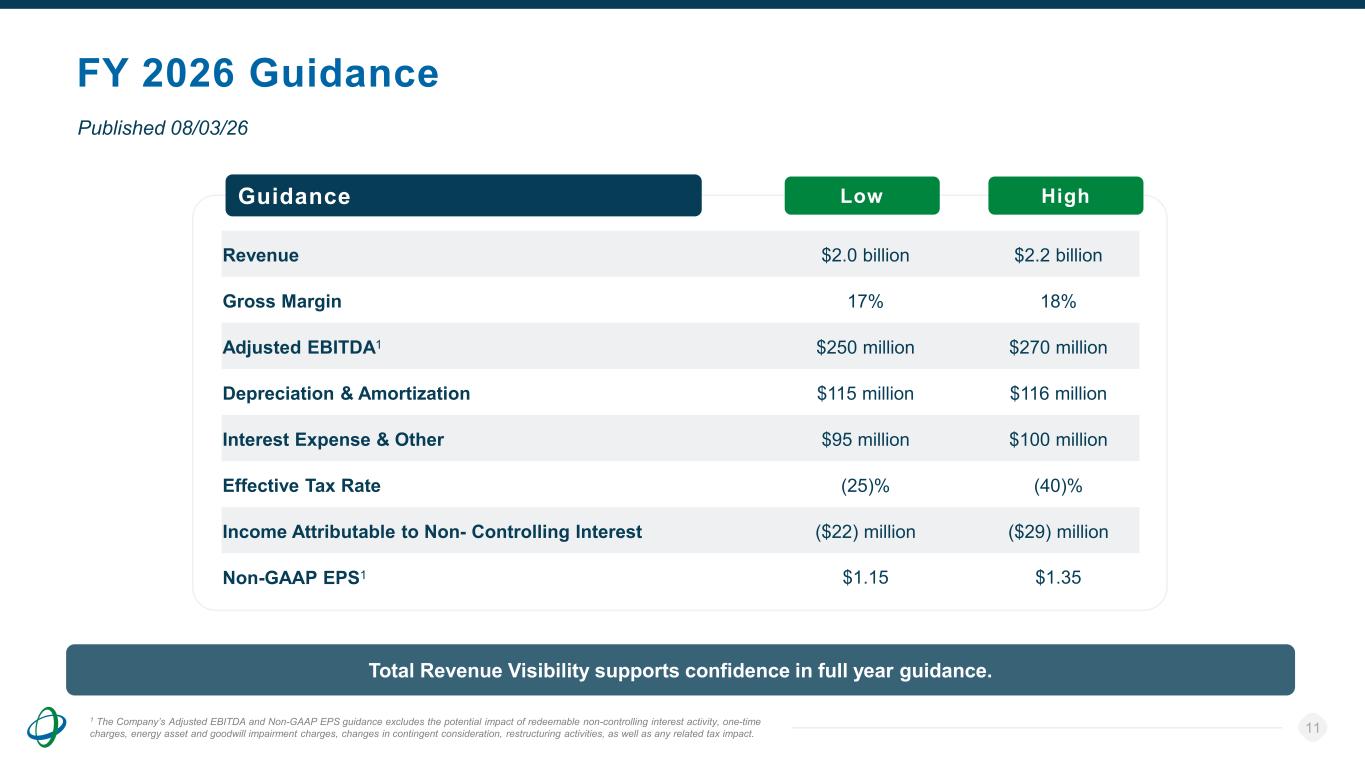
FY 2026 Guidance 11 Published 08/03/26 Total Revenue Visibility supports confidence in full year guidance. 1 The Company’s Adjusted EBITDA and Non-GAAP EPS guidance excludes the potential impact of redeemable non-controlling interest activity, one-time charges, energy asset and goodwill impairment charges, changes in contingent consideration, restructuring activities, as well as any related tax impact. Revenue $2.0 billion $2.2 billion Gross Margin 17% 18% Adjusted EBITDA1 $250 million $270 million Depreciation & Amortization $115 million $116 million Interest Expense & Other $95 million $100 million Effective Tax Rate (25)% (40)% Income Attributable to Non- Controlling Interest ($22) million ($29) million Non-GAAP EPS1 $1.15 $1.35 Low HighGuidance
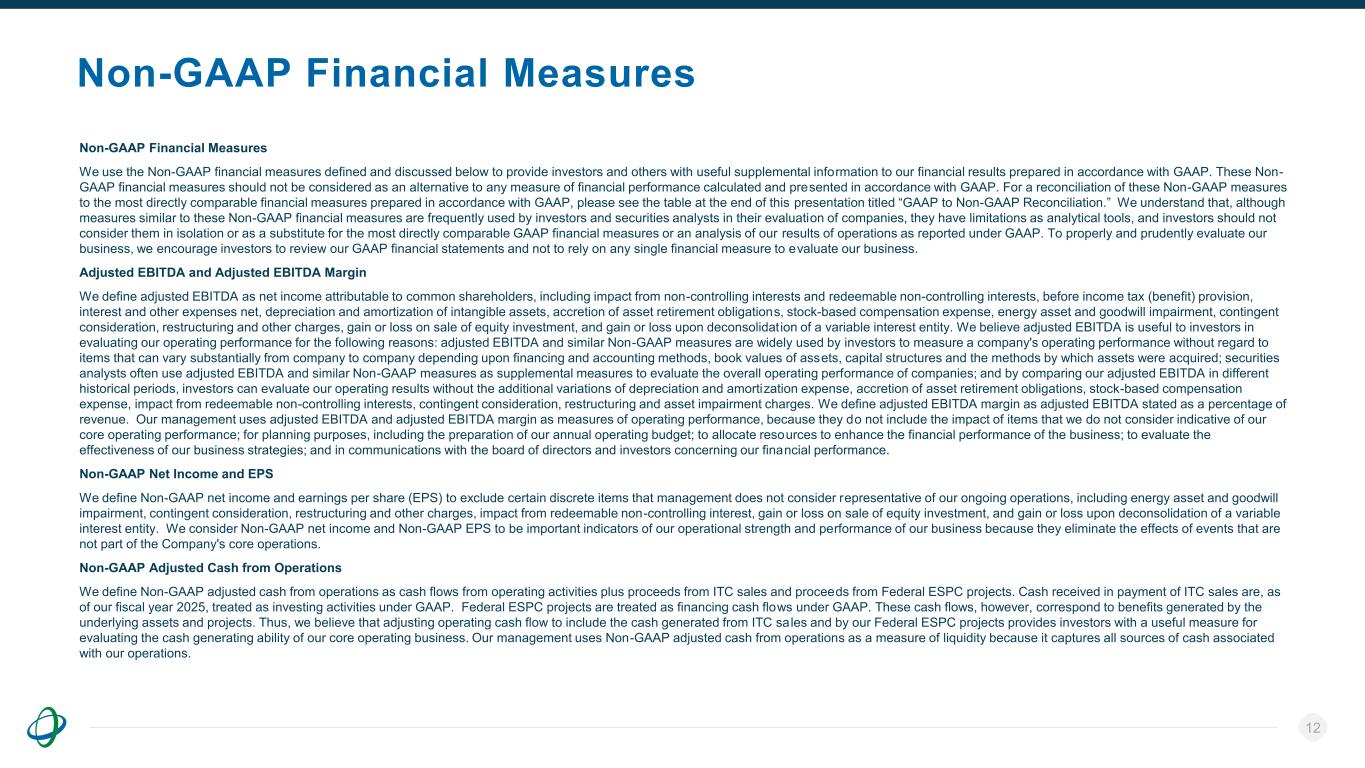
Non-GAAP Financial Measures 12 Non-GAAP Financial Measures We use the Non-GAAP financial measures defined and discussed below to provide investors and others with useful supplemental information to our financial results prepared in accordance with GAAP. These Non- GAAP financial measures should not be considered as an alternative to any measure of financial performance calculated and presented in accordance with GAAP. For a reconciliation of these Non-GAAP measures to the most directly comparable financial measures prepared in accordance with GAAP, please see the table at the end of this presentation titled “GAAP to Non-GAAP Reconciliation.” We understand that, although measures similar to these Non-GAAP financial measures are frequently used by investors and securities analysts in their evaluation of companies, they have limitations as analytical tools, and investors should not consider them in isolation or as a substitute for the most directly comparable GAAP financial measures or an analysis of our results of operations as reported under GAAP. To properly and prudently evaluate our business, we encourage investors to review our GAAP financial statements and not to rely on any single financial measure to evaluate our business. Adjusted EBITDA and Adjusted EBITDA Margin We define adjusted EBITDA as net income attributable to common shareholders, including impact from non-controlling interests and redeemable non-controlling interests, before income tax (benefit) provision, interest and other expenses net, depreciation and amortization of intangible assets, accretion of asset retirement obligations, stock-based compensation expense, energy asset and goodwill impairment, contingent consideration, restructuring and other charges, gain or loss on sale of equity investment, and gain or loss upon deconsolidation of a variable interest entity. We believe adjusted EBITDA is useful to investors in evaluating our operating performance for the following reasons: adjusted EBITDA and similar Non-GAAP measures are widely used by investors to measure a company's operating performance without regard to items that can vary substantially from company to company depending upon financing and accounting methods, book values of assets, capital structures and the methods by which assets were acquired; securities analysts often use adjusted EBITDA and similar Non-GAAP measures as supplemental measures to evaluate the overall operating performance of companies; and by comparing our adjusted EBITDA in different historical periods, investors can evaluate our operating results without the additional variations of depreciation and amortization expense, accretion of asset retirement obligations, stock-based compensation expense, impact from redeemable non-controlling interests, contingent consideration, restructuring and asset impairment charges. We define adjusted EBITDA margin as adjusted EBITDA stated as a percentage of revenue. Our management uses adjusted EBITDA and adjusted EBITDA margin as measures of operating performance, because they do not include the impact of items that we do not consider indicative of our core operating performance; for planning purposes, including the preparation of our annual operating budget; to allocate resources to enhance the financial performance of the business; to evaluate the effectiveness of our business strategies; and in communications with the board of directors and investors concerning our financial performance. Non-GAAP Net Income and EPS We define Non-GAAP net income and earnings per share (EPS) to exclude certain discrete items that management does not consider representative of our ongoing operations, including energy asset and goodwill impairment, contingent consideration, restructuring and other charges, impact from redeemable non-controlling interest, gain or loss on sale of equity investment, and gain or loss upon deconsolidation of a variable interest entity. We consider Non-GAAP net income and Non-GAAP EPS to be important indicators of our operational strength and performance of our business because they eliminate the effects of events that are not part of the Company's core operations. Non-GAAP Adjusted Cash from Operations We define Non-GAAP adjusted cash from operations as cash flows from operating activities plus proceeds from ITC sales and proceeds from Federal ESPC projects. Cash received in payment of ITC sales are, as of our fiscal year 2025, treated as investing activities under GAAP. Federal ESPC projects are treated as financing cash flows under GAAP. These cash flows, however, correspond to benefits generated by the underlying assets and projects. Thus, we believe that adjusting operating cash flow to include the cash generated from ITC sales and by our Federal ESPC projects provides investors with a useful measure for evaluating the cash generating ability of our core operating business. Our management uses Non-GAAP adjusted cash from operations as a measure of liquidity because it captures all sources of cash associated with our operations.
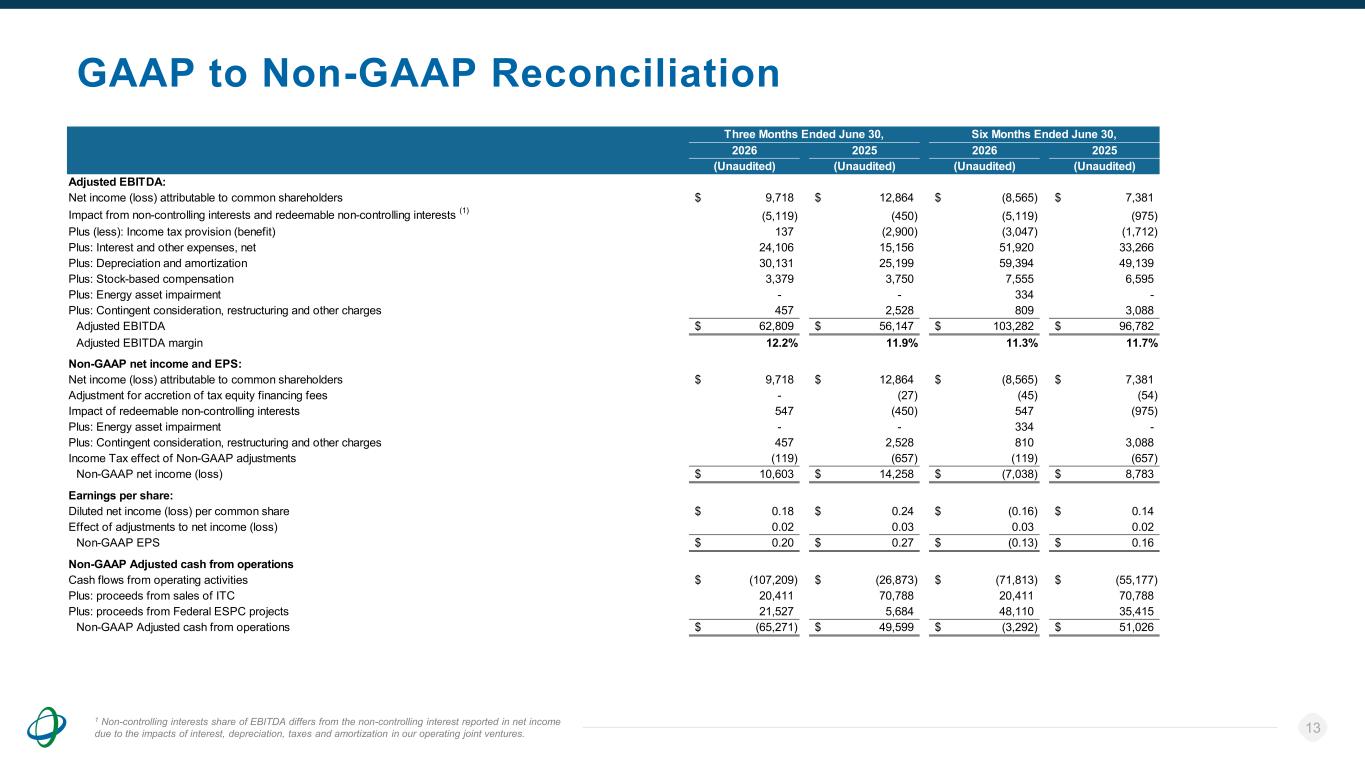
GAAP to Non-GAAP Reconciliation 13 (Unaudited) (Unaudited) (Unaudited) (Unaudited) Adjusted EBITDA: Net income (loss) attributable to common shareholders 9,718$ 12,864$ (8,565)$ 7,381$ Impact from non-controlling interests and redeemable non-controlling interests (1) (5,119) (450) (5,119) (975) Plus (less): Income tax provision (benefit) 137 (2,900) (3,047) (1,712) Plus: Interest and other expenses, net 24,106 15,156 51,920 33,266 Plus: Depreciation and amortization 30,131 25,199 59,394 49,139 Plus: Stock-based compensation 3,379 3,750 7,555 6,595 Plus: Energy asset impairment - - 334 - Plus: Contingent consideration, restructuring and other charges 457 2,528 809 3,088 Adjusted EBITDA 62,809$ 56,147$ 103,282$ 96,782$ Adjusted EBITDA margin 12.2% 11.9% 11.3% 11.7% Non-GAAP net income and EPS: Net income (loss) attributable to common shareholders 9,718$ 12,864$ (8,565)$ 7,381$ Adjustment for accretion of tax equity financing fees - (27) (45) (54) Impact of redeemable non-controlling interests 547 (450) 547 (975) Plus: Energy asset impairment - - 334 - Plus: Contingent consideration, restructuring and other charges 457 2,528 810 3,088 Income Tax effect of Non-GAAP adjustments (119) (657) (119) (657) Non-GAAP net income (loss) 10,603$ 14,258$ (7,038)$ 8,783$ Earnings per share: Diluted net income (loss) per common share 0.18$ 0.24$ (0.16)$ 0.14$ Effect of adjustments to net income (loss) 0.02 0.03 0.03 0.02 Non-GAAP EPS 0.20$ 0.27$ (0.13)$ 0.16$ Non-GAAP Adjusted cash from operations Cash flows from operating activities (107,209)$ (26,873)$ (71,813)$ (55,177)$ Plus: proceeds from sales of ITC 20,411 70,788 20,411 70,788 Plus: proceeds from Federal ESPC projects 21,527 5,684 48,110 35,415 Non-GAAP Adjusted cash from operations (65,271)$ 49,599$ (3,292)$ 51,026$ 2026 2025 2026 2025 Six Months Ended June 30,Three Months Ended June 30, 1 Non-controlling interests share of EBITDA differs from the non-controlling interest reported in net income due to the impacts of interest, depreciation, taxes and amortization in our operating joint ventures.
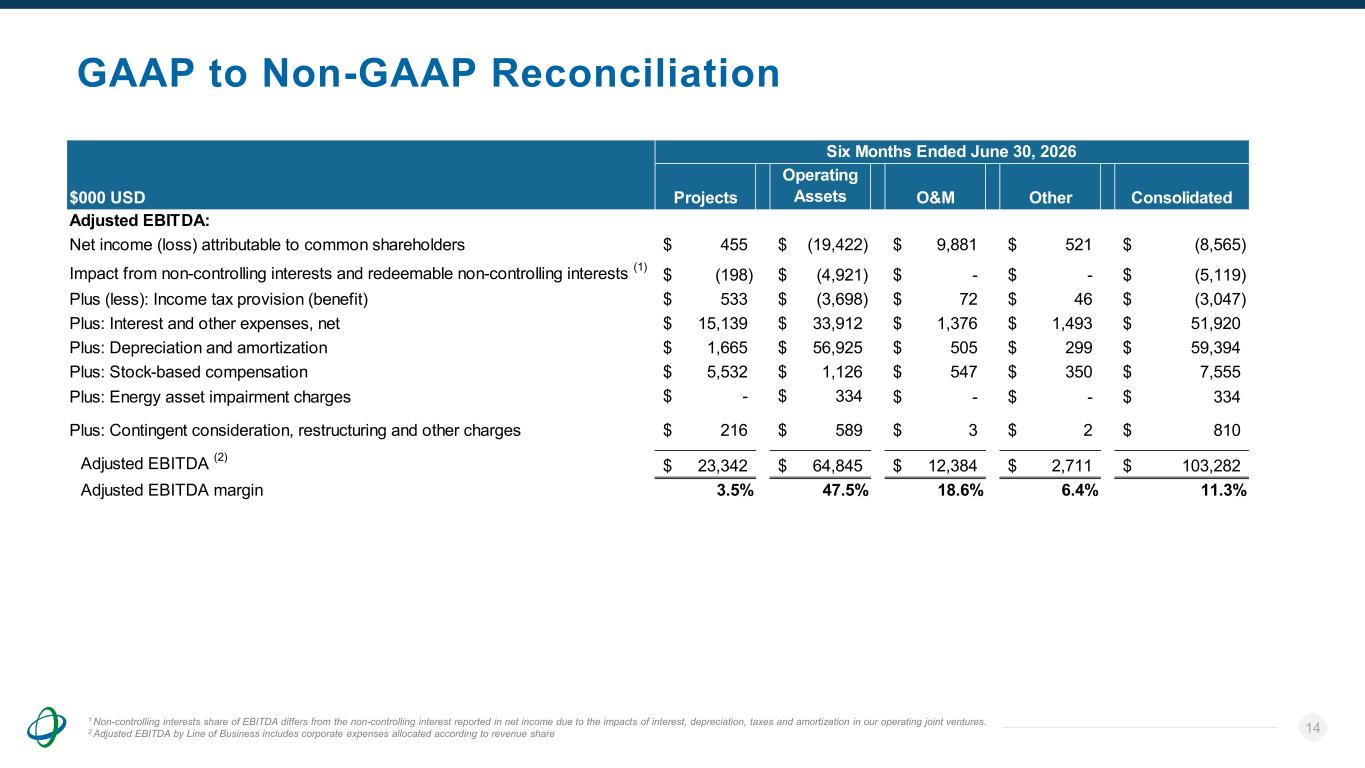
GAAP to Non-GAAP Reconciliation 14 1 Non-controlling interests share of EBITDA differs from the non-controlling interest reported in net income due to the impacts of interest, depreciation, taxes and amortization in our operating joint ventures. 2 Adjusted EBITDA by Line of Business includes corporate expenses allocated according to revenue share $000 USD Projects Operating Assets O&M Other Consolidated Adjusted EBITDA: Net income (loss) attributable to common shareholders 455$ (19,422)$ 9,881$ 521$ (8,565)$ Impact from non-controlling interests and redeemable non-controlling interests (1) (198)$ (4,921)$ -$ -$ (5,119)$ Plus (less): Income tax provision (benefit) 533$ (3,698)$ 72$ 46$ (3,047)$ Plus: Interest and other expenses, net 15,139$ 33,912$ 1,376$ 1,493$ 51,920$ Plus: Depreciation and amortization 1,665$ 56,925$ 505$ 299$ 59,394$ Plus: Stock-based compensation 5,532$ 1,126$ 547$ 350$ 7,555$ Plus: Energy asset impairment charges -$ 334$ -$ -$ 334$ Plus: Contingent consideration, restructuring and other charges 216$ 589$ 3$ 2$ 810$ Adjusted EBITDA (2) 23,342$ 64,845$ 12,384$ 2,711$ 103,282$ Adjusted EBITDA margin 3.5% 47.5% 18.6% 6.4% 11.3% Six Months Ended June 30, 2026
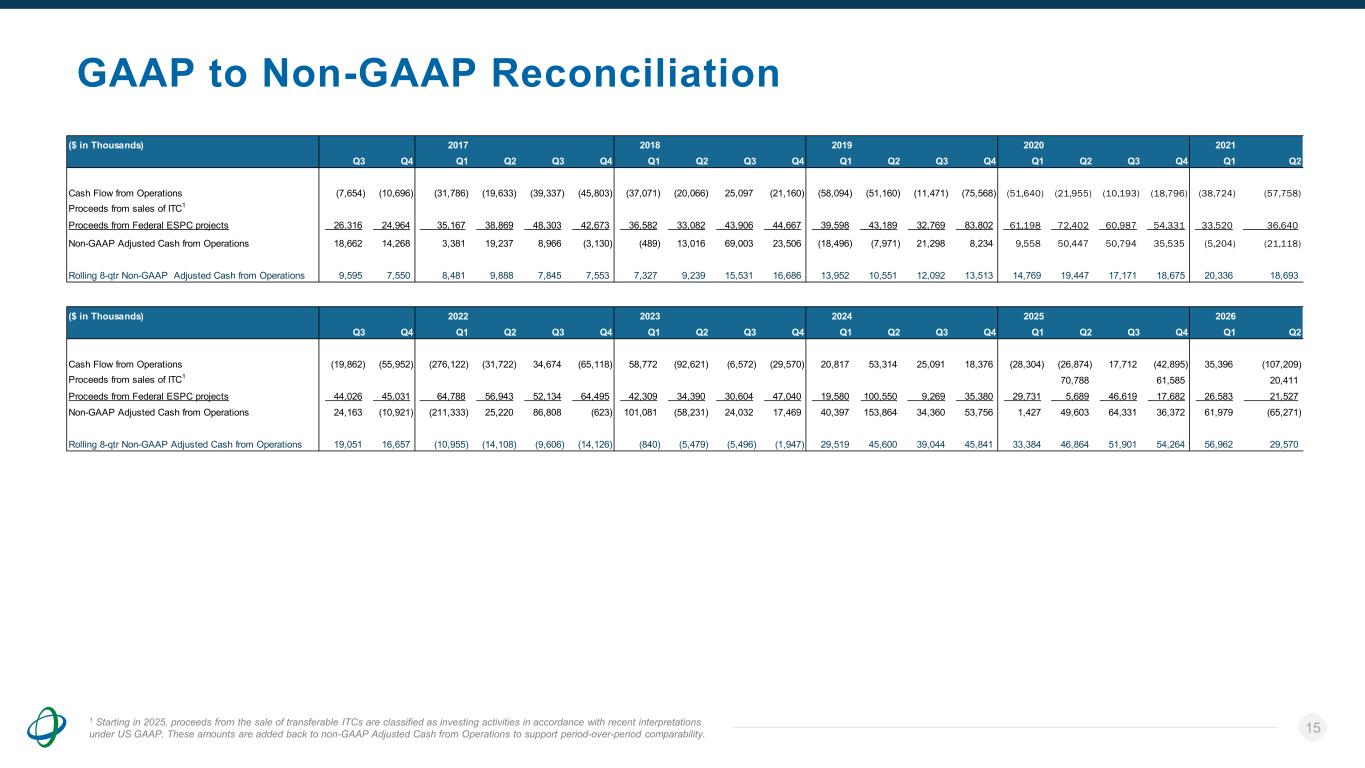
GAAP to Non-GAAP Reconciliation 15 ($ in Thousands) 2017 2018 2019 2020 2021 Q3 Q4 Q1 Q2 Q3 Q4 Q1 Q2 Q3 Q4 Q1 Q2 Q3 Q4 Q1 Q2 Q3 Q4 Q1 Q2 Cash Flow from Operations (7,654) (10,696) (31,786) (19,633) (39,337) (45,803) (37,071) (20,066) 25,097 (21,160) (58,094) (51,160) (11,471) (75,568) (51,640) (21,955) (10,193) (18,796) (38,724) (57,758) Proceeds from sales of ITC1 Proceeds from Federal ESPC projects 26,316 24,964 35,167 38,869 48,303 42,673 36,582 33,082 43,906 44,667 39,598 43,189 32,769 83,802 61,198 72,402 60,987 54,331 33,520 36,640 Non-GAAP Adjusted Cash from Operations 18,662 14,268 3,381 19,237 8,966 (3,130) (489) 13,016 69,003 23,506 (18,496) (7,971) 21,298 8,234 9,558 50,447 50,794 35,535 (5,204) (21,118) Rolling 8-qtr Non-GAAP Adjusted Cash from Operations 9,595 7,550 8,481 9,888 7,845 7,553 7,327 9,239 15,531 16,686 13,952 10,551 12,092 13,513 14,769 19,447 17,171 18,675 20,336 18,693 ($ in Thousands) 2022 2023 2024 2025 2026 Q3 Q4 Q1 Q2 Q3 Q4 Q1 Q2 Q3 Q4 Q1 Q2 Q3 Q4 Q1 Q2 Q3 Q4 Q1 Q2 Cash Flow from Operations (19,862) (55,952) (276,122) (31,722) 34,674 (65,118) 58,772 (92,621) (6,572) (29,570) 20,817 53,314 25,091 18,376 (28,304) (26,874) 17,712 (42,895) 35,396 (107,209) Proceeds from sales of ITC1 70,788 61,585 20,411 Proceeds from Federal ESPC projects 44,026 45,031 64,788 56,943 52,134 64,495 42,309 34,390 30,604 47,040 19,580 100,550 9,269 35,380 29,731 5,689 46,619 17,682 26,583 21,527 Non-GAAP Adjusted Cash from Operations 24,163 (10,921) (211,333) 25,220 86,808 (623) 101,081 (58,231) 24,032 17,469 40,397 153,864 34,360 53,756 1,427 49,603 64,331 36,372 61,979 (65,271) Rolling 8-qtr Non-GAAP Adjusted Cash from Operations 19,051 16,657 (10,955) (14,108) (9,606) (14,126) (840) (5,479) (5,496) (1,947) 29,519 45,600 39,044 45,841 33,384 46,864 51,901 54,264 56,962 29,570 1 Starting in 2025, proceeds from the sale of transferable ITCs are classified as investing activities in accordance with recent interpretations under US GAAP. These amounts are added back to non-GAAP Adjusted Cash from Operations to support period-over-period comparability.